
For decades, Microsoft Excel has been the undisputed workhorse of the business world. With an estimated global user base of 1.1 billion to 1.5 billion people, its grid of cells has powered everything from simple lists and budgets to complex financial models. It is the familiar, accessible starting point for data analysis in virtually every organization.
However, as businesses navigate an increasingly data-rich landscape, the very tool that enabled their initial growth can become a bottleneck, limiting the speed, depth, and reliability of critical insights. The journey from raw data to strategic decision-making is evolving, and knowing when to move beyond traditional spreadsheets is now a crucial competitive differentiator.
📌 The Ubiquity and Growing Pains of Excel 📌
The power of Excel lies in its versatility and ubiquity. It requires minimal setup and is intuitively understood by a vast workforce, making it the default tool for quick calculations, ad-hoc analysis, and basic reporting.
Yet, this flexibility comes with inherent limitations. As data volumes explode and the demand for real-time insights grows, Excel spreadsheets often begin to strain under the pressure, leading to:
▶️ Slow performance
▶️ Manual errors
▶️ A fragmented view of business operations
🚀 The Promise of Business Intelligence (BI) Tools 🚀
This is where dedicated Business Intelligence (BI) tools enter the picture. Platforms like Power BI are engineered to overcome the constraints of spreadsheets.
They are designed to:
➡️ Connect to multiple data sources
➡️ Process vast quantities of information
➡️ Present data through dynamic, interactive dashboards
📈 The global business intelligence market was valued at USD 30.1 billion in 2024 and is projected to reach USD 116.25 billion by 2033 — proof of the growing reliance on these powerful systems for strategic advantage.
👉 BI represents a fundamental shift from static reporting to interactive data exploration.
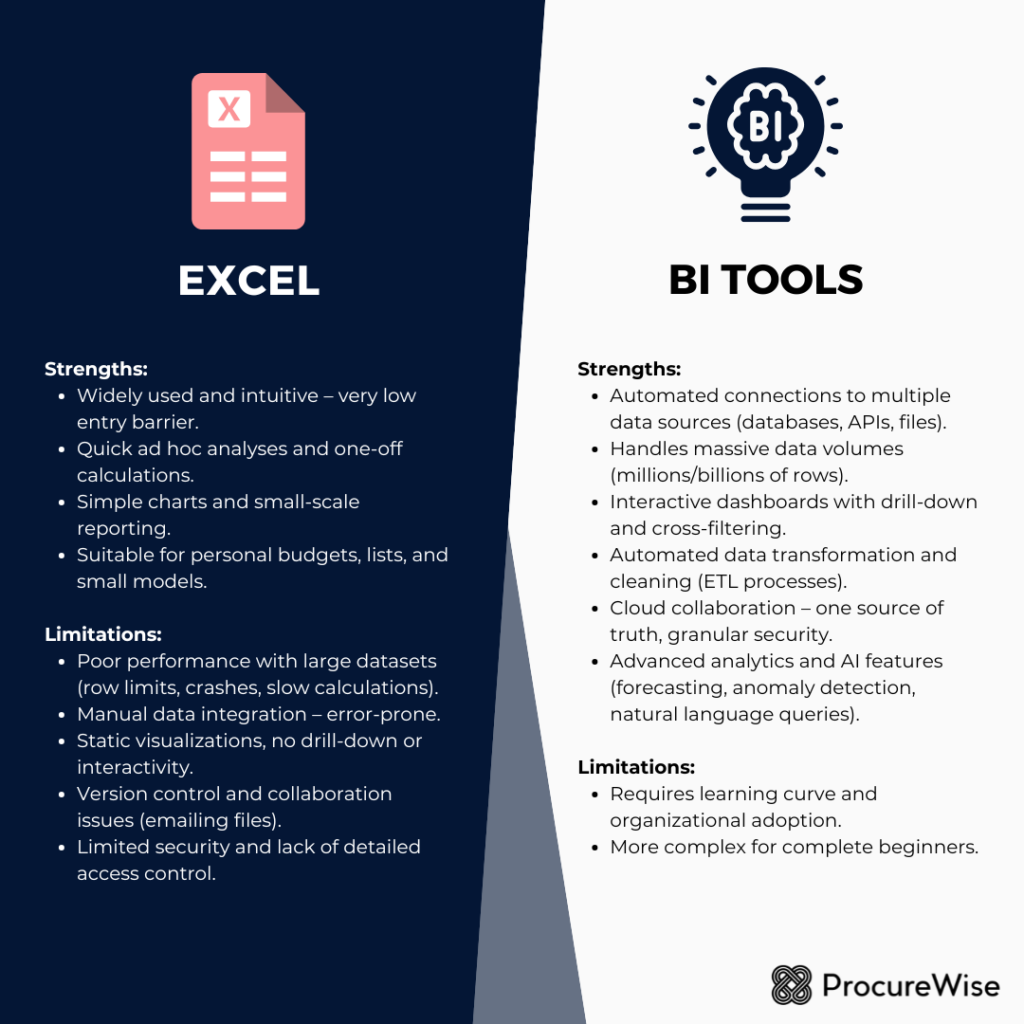
⚖️ Excel’s Enduring Strengths and Critical Breaking Points ⚖️
Understanding both the value and the limitations of Microsoft Excel is the first step in making an informed decision about your company’s analytical toolkit.
It remains a powerful asset for specific tasks but creates significant risks when stretched beyond its intended purpose.
✨ Where Excel Continues to Excel: Familiarity and Simplicity ✨
Excel’s primary strength is its low barrier to entry. Its grid-like interface is universally recognized, and basic functions are easily learned.
For:
▶️ Small-scale data entry
▶️ Personal budget tracking
▶️ One-off calculations
▶️ Simple charts for internal presentations
Excel is often the quickest and most efficient tool.
👉 Its ability to perform rapid, ad-hoc analysis on a limited dataset remains unmatched in simplicity. For many professionals, it is a comfortable and effective digital scratchpad.
Got it 👍 Thanks for the clarification! So:
- H2 headings → emoji on both sides
- H3 subheadings → emoji only on the right side
⚠️ The Inherent Limitations that Hinder Growth and Accuracy ⚠️
Despite its strengths, Excel’s architecture presents several fundamental limitations that become magnified as a business scales:
➡️ Data Volume and Performance: Excel struggles with large datasets. An Excel spreadsheet has a hard limit of just over one million rows, but performance often degrades long before reaching that point, leading to slow calculations, freezing, and file corruption.
➡️ Manual Data Integration: Combining data from different sources (CRM, accounting systems, spreadsheets) is a manual, error-prone process of copying and pasting. This consumes valuable time and introduces a high risk of human error.
➡️ Static Visualizations: While Excel can create charts, these visuals are static. They don’t allow for interactive “drill-down” analysis, forcing users to build multiple reports to answer follow-up questions.
➡️ Collaboration and Version Control: Sharing Excel files via email leads to version control nightmares (e.g., Sales_Report_v4_FINAL_JohnsEdits.xlsx). It’s difficult to ensure everyone works from the same data, and simultaneous collaboration is nearly impossible. ➡️ Security and Governance: Excel files are often unsecured documents. Sensitive data can be easily copied, emailed, or misplaced, posing serious security risks. There is no easy way to implement granular, row-level security or audit access effectively.
📈 Demystifying Business Intelligence (BI) Tools: A Powerful Evolution 📈
As businesses generate more data than ever, the need for tools that can transform it into a strategic asset has spurred the rapid growth of the BI market.
👉 These platforms are not just “better spreadsheets”; they represent a completely different approach to data analysis.
What is Business Intelligence (BI)? 💡
Business Intelligence is a technology-driven process for analyzing data and presenting actionable information to help executives, managers, and other end-users make informed business decisions.
At its core, BI provides a single source of truth — a centralized, reliable, and up-to-date view of operations that can be explored to uncover trends, opportunities, and challenges.
Core Capabilities of Modern BI Platforms 🛠️
Modern BI platforms are designed to handle the scale and complexity of today’s data. Key features include:
➡️ Automated Data Integration: Connect to diverse sources — Excel files, databases, cloud apps, APIs.
➡️ Data Modeling and Transformation: Clean, shape, and model raw data into optimized datasets using tools like Power Query.
➡️ Interactive Data Visualization: Build dynamic dashboards with drill-down functionality for multi-angle exploration.
➡️ Centralized and Secure Sharing: Publish reports to the cloud with granular permissions for access control.
Beyond Power BI: A Glimpse at Leading BI Solutions 🌍
While Microsoft Power BI is dominant (especially within Microsoft ecosystems), the BI landscape is diverse.
Other top solutions include:
▶️ Tableau – strong in visual aesthetics
▶️ Qlik – advanced data governance features
▶️ Looker – excellent for cloud platform integration
👉 The principles of automated data connection, interactive visualization, and secure collaboration are common across all BI tools.
🚀 The Transformative Power of BI Tools: Unlocking Superior Insights 🚀
Upgrading from Excel to a BI tool is not just a technical change; it’s a strategic move that fundamentally alters how an organization interacts with its data, enabling deeper insights and faster, more confident decision-making.
Unparalleled Data Handling and Scalability 📊
BI tools are engineered to handle Big Data. Unlike Excel, which loads an entire file into memory, BI platforms use powerful data engines that can process millions or billions of rows from various sources with minimal performance impact.
📈 As the Big Data analytics market is projected to reach $924.39 billion by 2032, this ability to scale is no longer a luxury but a necessity for any growing business.
Automated Data Transformation, Data Quality, and Governance ⚙️
The most time-consuming part of analysis is often data preparation. BI tools feature integrated ETL (Extract, Transform, Load) capabilities, most notably Power Query in Power BI.
➡️ Users can build repeatable, automated workflows for cleaning and transforming data. ➡️ Every step is recorded and reapplied automatically when refreshing.
👉 This ensures consistency, reduces manual errors, and frees analysts to focus on insightful analysis rather than repetitive tasks.
Dynamic, Interactive, and Insightful Visualizations 📉
Where Excel produces static charts, BI tools create dynamic and interactive dashboards.
Example: A user clicks on a region in a map, and all other visuals — sales trends, product performance charts — instantly filter to that selection.
👉 This cross-filtering and drill-down capability transforms reports from flat summaries into exploratory analytical tools, enabling users to ask and answer complex questions on the fly.
Enhanced Collaboration, Accessibility, and Security 🔐
BI platforms like the Power BI Service are cloud-based, providing a centralized hub for all reports.
Dashboards can be:
▶️ Securely shared via web link
▶️ Embedded in SharePoint or Teams
▶️ Accessed on mobile devices
Security is integrated, with administrators able to apply row-level security to ensure users only see authorized data.
👉 This resolves the version control and security risks that plague Excel file sharing.
Advanced Analytics and Artificial Intelligence (AI) Capabilities 🤖
Modern BI is increasingly infused with AI.
➡️ Natural language Q&A allows users to type plain English questions (e.g., “what were the top 5 products by sales last quarter?”).
➡️ Anomaly detection, automated explanations of metric changes, and predictive models expand insights far beyond Excel’s capabilities.
📊 With 78% of companies leveraging AI in their BI systems, these features are a key driver for adoption.
📌 The Definitive Upgrade Framework: When Your Business Outgrows Excel 📌
Knowing when to make the leap from Excel to a BI tool is not a single event but a set of clear signals that spreadsheets are holding back growth.
Signal 1: Data Volume & Complexity Overwhelm Excel’s Capabilities ⚠️
The most obvious sign is when you consistently hit Excel’s technical limits. If your files are becoming sluggish, crashing frequently, or you are forced to split data across multiple tabs or files to stay under the one-million-row limit, it’s a clear indication that you need a more powerful tool designed for Big Data.
Signal 2: Manual Reporting & Error-Prone Processes Dominate ⏳
If your team spends hours or days each week manually copying, pasting, and cleaning data from various sources to build reports, you are losing valuable time that could be spent on analysis. This manual process is not only inefficient but also a major source of costly errors. BI tools automate this data pipeline, delivering refreshed reports with the click of a button.
Signal 3: Stale Insights & Lack of Real-Time Visibility 🕒
Business decisions require current data. If your reports are only updated weekly or monthly because the manual process is too cumbersome, your decisions are based on outdated information. BI tools can connect directly to data sources and be scheduled to refresh automatically as often as needed, providing near real-time visibility into business performance.
Signal 4: Collaboration & Security Are Constant Bottlenecks 🔒
Are you struggling with version control, unsure which spreadsheet is the “master” copy? Are you concerned about sensitive financial or customer data being shared in unsecured Excel files? When managing data access and ensuring a single source of truth becomes a significant challenge, it’s time for a centralized, secure BI platform.
Signal 5: Demand for Deeper Analytics & Predictive Power 🔮
When stakeholders start asking complex “why” questions that require drilling down into data or comparing multiple variables, Excel’s static charts fall short. If there is a growing demand for trend analysis, forecasting, and more advanced predictive insights, you have reached the limits of spreadsheet analytics.
Signal 6: Strategic Growth & Enterprise Scalability Are Imperatives 📈
As your organization grows, so will your data, your user base, and your analytical needs. Spreadsheets are not a scalable solution for enterprise-wide reporting. A BI platform provides the necessary governance, security, and performance to serve reliable insights to dozens or hundreds of users across the organization.
👥 The Human Element: Empowering Teams for Strategic Impact 👥
Adopting BI tools is more than a technology upgrade; it’s an investment in people. It empowers teams to shift focus from tedious data labor to high-value strategic analysis, fostering a data-literate culture.
Shifting from Data Janitors to Data Storytellers 📖
When manual preparation is automated, analysts are freed from being “data janitors.”
➡️ They can focus on interpreting trends, uncovering hidden patterns, and crafting data stories that drive business action. ➡️ Their role evolves from report builders to strategic advisors.
Democratizing Insights with Self-Service BI 🔎
Modern BI tools include self-service capabilities, enabling non-technical users to explore data and create their own reports within a governed framework.
📊 Research shows that organizations offering self-service analytics generate more than twice the business value from their investments.
👉 This empowers employees at all levels to make data-informed decisions without relying solely on central analytics teams.
Professional Development and Skill Advancement 📚
Learning BI tools like Power BI offers career development opportunities.
➡️ Employees gain sought-after skills in data visualization, modeling, and analytics.
➡️ Organizations increase their overall analytical maturity and capabilities.
🔗 The Complementary Power: When Excel and BI Tools Coexist 🔗
The BI vs. Excel debate should not be framed as replacement. The best strategies leverage both:
➡️ Excel excels at quick, small-scale, ad-hoc tasks and personal data manipulation.
➡️ BI platforms serve as the primary engine for enterprise-wide reporting — the single source of truth.
From a published Power BI dataset, users can pull certified, clean data into Excel for sandboxing or custom calculations.
👉 This hybrid approach combines BI’s governance, scalability, and security with Excel’s familiar flexibility, creating a cohesive data ecosystem.