Key Performance Indicators (KPIs) are essential for measuring the success and effectiveness of your business. They provide a way to track progress, identify areas for improvement, and make data-driven decisions.
In this article, we will explore 23 examples of business KPIs across various industries and functions, ranging from sales and marketing to operations and finance. By understanding and implementing these KPIs effectively, you can drive growth, enhance performance, and achieve your business goals. Read more KPIs meaning, what is it? Types and examples
📄Explanation of Key Performance Indicators (KPIs) 📄
Key Performance Indicators (KPIs) are key metrics for gauging an organization’s progress toward strategic objectives. They offer quantifiable insights into whether the company is meeting its goals or falling short. KPIs are carefully chosen to directly measure success or failure in achieving strategic aims, fostering teamwork and clarity across the organization.
It’s crucial to limit the number of KPIs tracked—typically 5 to 10—to prevent confusion and prioritize efforts effectively. These metrics must be relevant, measurable, and closely tied to the company’s strategic direction.
KPIs serve as a compass, guiding the organization towards its desired outcomes by providing actionable data. They align employees, encourage collaboration, and inform decision-making processes. By selecting a concise set of meaningful KPIs, companies can maintain focus and clarity while tracking performance.
Take advantage of our services for reports and management dashboards now!
⚠️ Importance of tracking business performance metrics ⚠️
Monitoring business performance metrics is vital for organizational success, offering valuable insights to drive data-driven decisions. By tracking key performance indicators (KPIs), businesses pinpoint areas for improvement and compare against industry standards or past performance to refine strategies. For instance, an ecommerce company may analyze conversion rates and customer lifetime value to optimize marketing approaches and website functionality.
Data-driven decisions are essential for success, enabling organizations to adapt and thrive. By assessing metrics like production yield and customer satisfaction, operations teams can identify bottlenecks and enhance processes. Overall, tracking metrics empowers businesses across sectors to refine strategies, enhance efficiency, and elevate customer experiences, ensuring competitiveness in the market.

📚 23 KPI Examples 📚
1. Revenue growth 💰
One crucial key performance indicator for businesses is revenue growth. This metric measures the increase in revenue over a specified period of time and indicates the financial health and success of a company. By tracking revenue growth, businesses can analyze their sales performance, identify trends, and make informed decisions to drive further growth and success.
2. Net profit margin 🏷️
Net profit margin is a financial metric that shows the profitability of a business by calculating the percentage of revenue that is left after all expenses have been deducted. A higher net profit margin indicates that the business is operating efficiently and effectively managing its expenses. This metric is important for assessing the overall financial health and success of a company.
3. Customer acquisition cost (CAC) 💵
Customer Acquisition Cost (CAC) is a key performance indicator that calculates the average cost to acquire a new customer, it is one of marketing KPIs. It is calculated by dividing the total costs associated with acquiring new customers (such as marketing and sales expenses) by the number of new customers acquired. Keeping track of your CAC can help you assess the effectiveness of your marketing and sales efforts and make informed decisions on where to allocate resources for acquiring new customers.
4. Website traffic 🚦
One key performance indicator for businesses is website traffic. Monitoring the number of visitors to your website can give you valuable insights into the effectiveness of your marketing efforts and the overall interest in your products or services. By tracking website paid and organic traffic, businesses can identify trends, measure the success of marketing campaigns, and make data-driven decisions to optimize their online presence.
5. Market share 🛍️
Market share is a key performance indicator that measures the percentage of total sales in a specific market that your business holds. It can give insights into your competitive position and help identify opportunities for growth. Tracking market share over time can help you evaluate the effectiveness of your marketing and sales strategies.
6. Return on investment (ROI) 🧾
ROI is a crucial KPI for businesses, as it measures the efficiency and profitability of an investment. By comparing the amount gained or lost relative to the amount invested, businesses can determine the success of their initiatives. This KPI is essential for decision-making and resource allocation, allowing businesses to prioritize investments that bring the highest returns.
7. Cash flow 🪙
Cash flow is a crucial KPI for any business, as it reflects the amount of money coming in and going out of your business. Monitoring cash flow can help you identify any potential liquidity issues, ensure you have enough funds to cover operational expenses, and make strategic financial decisions. This KPI can also provide insight into your business’s overall financial health and sustainability.
8. Bounce Rate ⛔
Bounce Rate is a key performance indicator that measures the percentage of visitors who navigate away from your website after viewing only one page. A high bounce rate can indicate that your website content or user experience may not be engaging or relevant to visitors. It’s important to track and analyze bounce rate to optimize your website and improve overall user engagement.
9. Number of contracts signed within a specific time period 📋
This KPI can indicate the effectiveness of your sales team and the overall growth of your business. By tracking the number of contracts signed within a specific time period, you can measure the success of your sales efforts and identify any areas for improvement. Additionally, this KPI can help you forecast future revenue and set realistic targets for your sales team.
10. Percentage increase in sales revenue compared to previous periods 📊
This KPI measures the percentage increase in sales revenue compared to previous periods. It helps businesses track their sales growth over time and determine the effectiveness of their sales strategies. By analyzing this KPI, businesses can identify trends, patterns, and areas for improvement in their sales processes.
11. Conversion rate of leads into qualified opportunities 🎁
This KPI measures the percentage of leads that are successfully converted into qualified opportunities for your business. A high conversion rate indicates that your sales and marketing efforts are effective in moving leads through the sales pipeline. It is important to track this KPI to ensure that your business is maximizing its potential for growth and revenue.
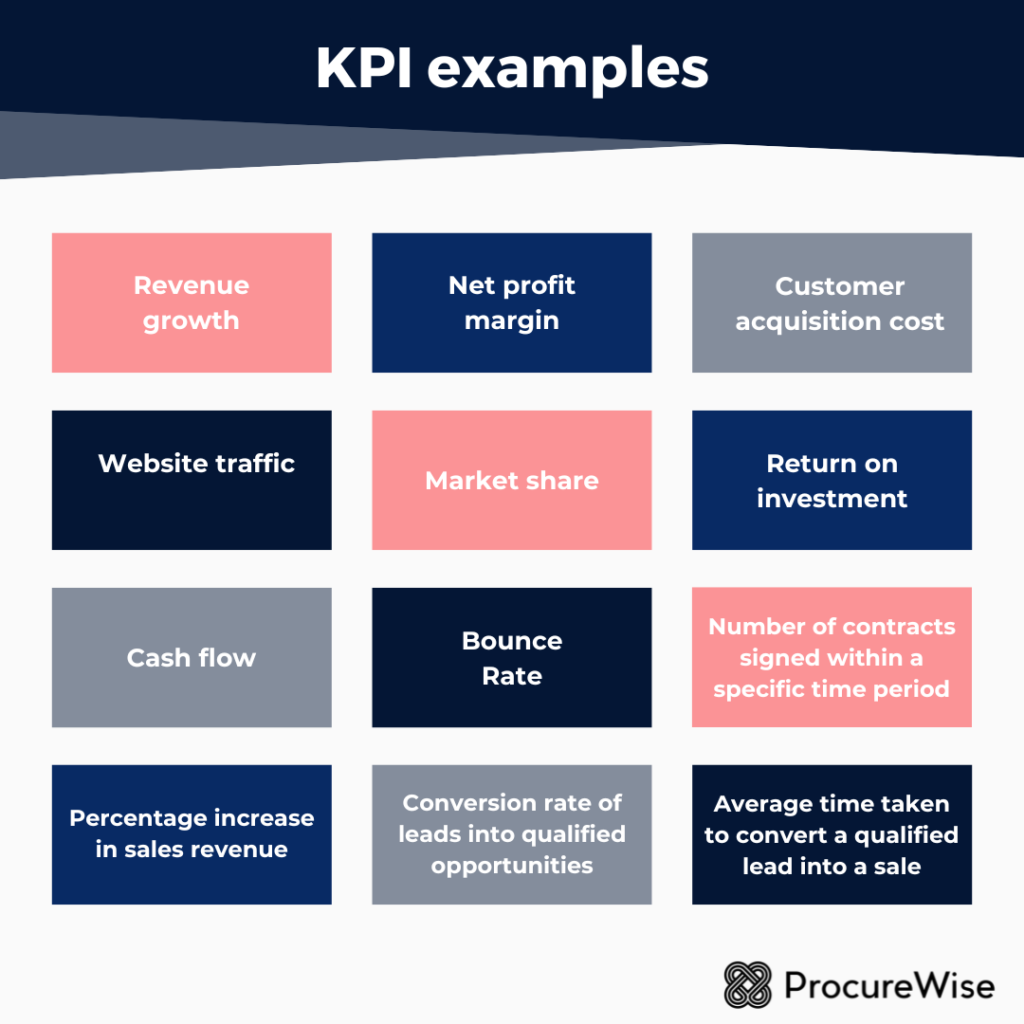
12. Average time taken to convert a qualified lead into a sale 🎯
This sales KPI measures the efficiency of your sales process. By tracking the average time taken to convert a qualified lead into a sale, you can identify bottlenecks in your sales funnel and make adjustments to improve conversion rates. This metric can help you make informed, strategic decisions on sales strategies, lead nurturing tactics, and resource allocation to ensure optimal sales performance.
13. Percentage of sales opportunities successfully closed ✅
This KPI measures the efficiency and effectiveness of your sales team in converting leads into customers. It can help identify areas of improvement in the sales process and highlight top-performing salespeople. By tracking this metric, you can optimize your sales strategy and increase overall revenue.
14. Sales velocity, indicating the average time taken to close a deal ⏱️
Sales velocity is a key performance indicator that can provide valuable insights into your sales process. By tracking the average time taken to close a deal, you can identify areas where your sales team may be getting stuck or where there may be inefficiencies. This KPI can help you make informed decisions about resource allocation, training opportunities, and overall sales strategy to improve your bottom line.
15. Average response time for sales inquiries or leads 📜
To measure the effectiveness of your sales team and customer service, track the average response time for sales inquiries or leads. This KPI can help you identify any bottlenecks in your sales process and ensure that leads are being followed up with promptly. A shorter response time can also lead to higher conversion rates and customer satisfaction.
16. Number of repeat customers or customer retention rate 🤝
This KPI is essential for measuring the success of your business in retaining customers and building long-term relationships. By tracking the number of repeat customers or calculating your customer retention rate, you can gauge customer satisfaction, loyalty, and the effectiveness of your marketing and customer service efforts. Aim to increase your repeat customers and retention rate over time to drive sustainable growth and profitability for your business.
17. Conversion rate of website visitors into sales leads 🖥️
This KPI measures the percentage of website visitors who take a desired action, such as signing up for a newsletter or making a purchase. A high conversion rate indicates that your website is effectively engaging and persuading visitors to become leads or customers. To improve this KPI, you can optimize your website design, user experience, and content to drive more conversions.
18. Ratio of sales meetings to closed deals 👥
This KPI measures the efficiency of your sales team in converting meetings into closed deals. By tracking this ratio, you can identify any bottlenecks in your sales process and make necessary adjustments to increase your conversion rates. Keeping a close eye on this metric can help you optimize your sales strategy and drive more revenue for your business.
19. Percentage of sales quota achieved 🧺
This KPI measures the percentage of the sales quota that has been achieved in a specific time period. It helps businesses track the performance of their sales team and determine if they are meeting their sales targets. Monitoring this KPI can provide insights into the effectiveness of sales strategies and help identify areas for improvement.
20. Sales team productivity, measured by revenue per salesperson 📨
This KPI calculates the total revenue generated by each salesperson within a specific period. It helps to measure the efficiency and effectiveness of your sales team in generating sales. By tracking this metric, you can identify top-performing salespeople, areas for improvement, and overall sales team productivity.
21. Customer Churn Rate ❌
Customer churn rate is a crucial KPI for businesses, as it measures the percentage of customers who stop using your product or service over a certain period of time. A high churn rate could indicate issues with customer satisfaction, product quality, or competition. Monitoring and reducing customer churn rate is essential for maintaining a healthy and sustainable business.
22. Click-through rates 📌
Click-through rates are a key performance indicator that measures the percentage of people who click on a specific link or call-to-action in an email, ad, or other digital marketing material. This metric can provide insights into the effectiveness of your content and messaging, as well as the interest level of your audience. By tracking click-through rates, you can optimize your campaigns to drive more traffic and conversions.
23. Growth rate in sales revenue over a specified period 📈
This KPI measures the percentage increase in sales revenue over a specified period of time, such as quarterly or annually. It indicates how successful the business is in generating more revenue and growing its sales efforts. This KPI can help track the effectiveness of sales strategies and identify areas for improvement in the sales process.
These KPIs provide valuable insights into sales performance, enabling businesses to identify areas of improvement, set growth targets, and evaluate the effectiveness of various sales strategies. Monitoring these metrics regularly can help track progress and drive sales success.