As an executive, staying on top of your business’s performance and key metrics is crucial. That’s where executive dashboards and reporting come in. These tools provide a visual representation of your data, making it easier to analyze and make informed decisions.
In this article, we’ll explore 13 examples of executive dashboards and reports that can help you track KPIs, monitor performance, and drive business growth. Whether you’re looking for a sales dashboard, financial report, or HR analytics, we’ve got you covered. Let’s dive in and discover the power of executive dashboards and reporting. Read more 10 top tips to make most out of your marketing dashboards
❓What is an executive dashboard❓
An executive dashboard is a powerful tool that provides a visual representation of key performance indicators (KPIs) and critical business metrics in a single location. It offers executives and decision-makers a comprehensive overview of the organization’s performance, allowing them to track and analyze important data to make informed decisions.
📌 One of the main features of an executive dashboard is its ability to consolidate data from various sources, such as sales, marketing, finance, and operations. This consolidation eliminates the need to manually collect and analyze data from different systems, saving time and effort. Executives can easily access real-time information and gain insights into the company’s overall productivity, revenue, and other relevant metrics.
📌 The main benefit of using executive dashboards is their role in enabling agile, data-driven decision-making. By providing a clear and concise view of KPIs, executives can quickly identify trends, patterns, and areas that need improvement. They can then use this data to make informed decisions that drive business growth and efficiency.
Using executive dashboards can have a significant impact on organizations’ decision-making processes. It allows executives to make data-driven decisions, ensuring they are based on factual information rather than intuition or guesswork. This leads to better resource allocation, improved performance, and ultimately, increased profitability. Therefore, implementing an executive dashboard can be a game-changer for organizations aiming to stay competitive in today’s fast-paced business environment.
🛠️ How do you build an executive dashboard? 🛠️
Building an executive dashboard involves several steps to ensure its effectiveness and alignment with organizational goals.
1️⃣ Consult with the executive team to understand their requirements and objectives. This helps in identifying the key performance indicators (KPIs) and key metrics that need to be tracked on the dashboard.
2️⃣ Decide on the type of dashboard that will best suit the needs of the executive team. This could be a static or interactive dashboard.
3️⃣ Create a mockup to visually represent how the dashboard will look and function. This allows for feedback and adjustments before moving forward.
4️⃣ Select the appropriate software for building the dashboard. The software should be capable of handling the data sources required for the KPIs and metrics.
5️⃣ Connect to the relevant data sources and ensure a smooth flow of data into the dashboard.
6️⃣ Create visualizations that effectively communicate the information. These visualizations should be clear, concise, and tailored to the needs of the executive team.
Once the visualizations are created, it is important to gather feedback from the executive team to make any necessary adjustments and ensure the dashboard meets their expectations. After incorporating feedback, the next step is to deploy the dashboard to the executive team, ensuring they have access to the relevant data and visualizations. Finally, it is essential to continuously gather feedback and iterate on the dashboard to improve its functionality and value over time.

🪚 How to make a good dashboard? 🪚
Creating an effective dashboard requires careful consideration of several key factors. Simplicity is paramount as it ensures that users can easily understand and navigate through the dashboard. Cluttered and complex dashboards can be overwhelming and hinder data interpretation. Similarly, data accuracy is crucial for building trust and confidence in the dashboard. Ensuring that the data is reliable and up-to-date is essential for making informed decisions.
⚙️ Regular updates are vital to keep the dashboard relevant and useful. Outdated information can mislead users and make the dashboard ineffective. By regularly refreshing the data and incorporating new insights, the dashboard remains valuable and reliable.
⚙️ User engagement is another critical aspect of building a good dashboard. By involving users in the design and development process, their needs and preferences can be considered. Incorporating interactive features and customizable options increases engagement and promotes active involvement. User feedback and continuous improvement are also necessary to ensure that the dashboard meets users’ evolving needs.
To summarize, simplicity, data accuracy, regular updates, and user engagement are key factors for creating an effective dashboard. By prioritizing these elements and leveraging suitable techniques and technologies, organizations can develop dashboards that provide meaningful insights and facilitate informed decision-making.
✅ Why have an executive dashboard? ✅
An executive dashboard is a powerful tool that enables smart choices and facilitates company growth. By presenting data through data visualization techniques, it offers a summary of key numbers and metrics, known as Key Performance Indicators (KPIs). This enables executives to have a clear understanding of the organization’s performance and progress towards its goals.
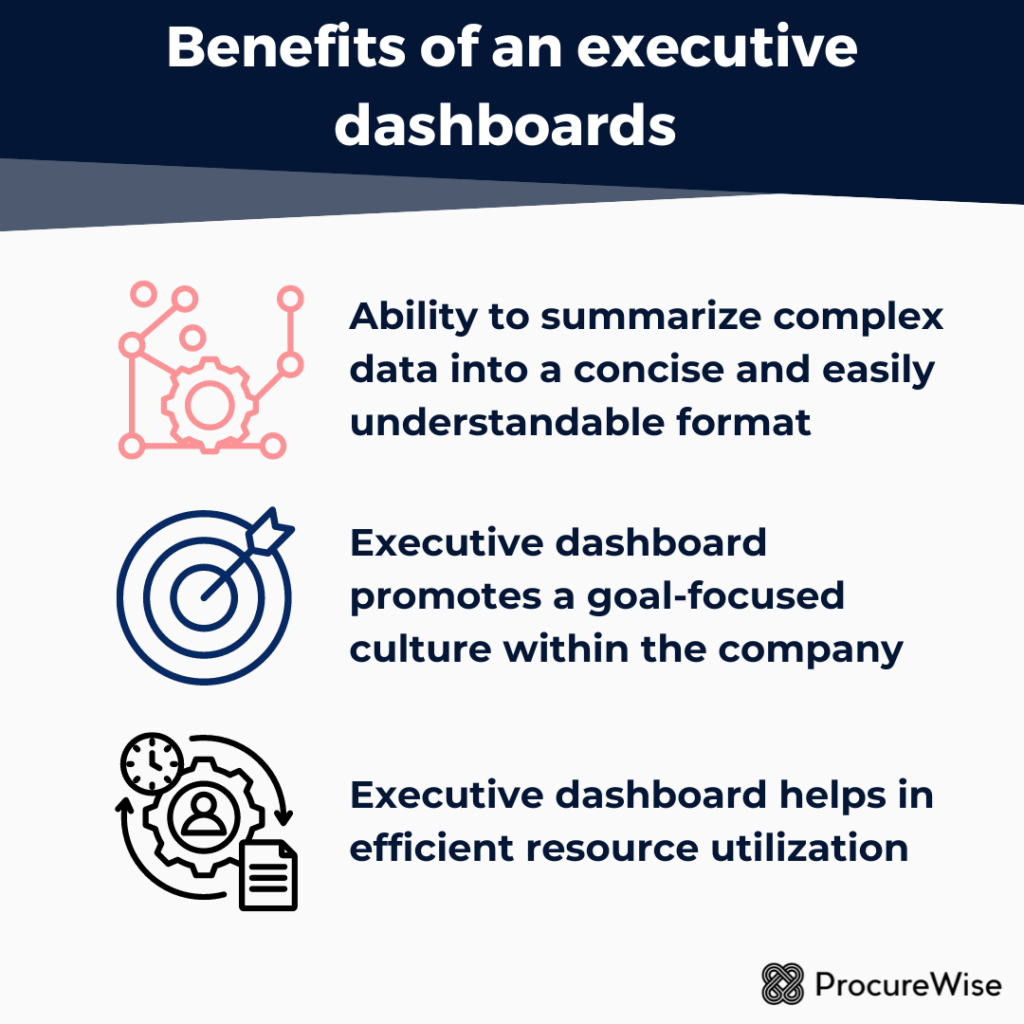
✔️ Ability to summarize complex data into a concise and easily understandable format. Instead of having to dig through spreadsheets and reports, executives can quickly access the important information that they need to make informed decisions. This allows for better teamwork and collaboration among departments, as everyone has a clear picture of the organization’s goals and how their individual tasks contribute to those goals.
✔️ Executive dashboard promotes a goal-focused culture within the company. By having goals and KPIs prominently displayed, employees at all levels are reminded of the targets they should be working towards. This not only increases productivity and efficiency but also ensures that everyone is aligned and working towards the same objectives.
✔️ Executive dashboard helps in efficient resource utilization. By providing real-time data and insights, it enables executives to identify areas of improvement and allocate resources accordingly. This allows for better planning and optimization, ultimately leading to cost savings and improved performance.
Overall, an executive dashboard plays a vital role in driving organizational success by providing a visual representation of data, summarizing key numbers and KPIs, fostering better teamwork, maintaining goal focus, and enabling efficient resource utilization.
📚 13 Executive dashboard examples 📚
Executive dashboards are powerful tools that provide executives with a quick overview of key performance metrics and data to make informed decisions. Here are 13 examples of executive dashboards with their purposes and specific data communicated.
- Financial Dashboard: This dashboard provides a high-level overview of the organization’s financial performance, allowing executives to quickly assess key financial metrics and make informed decisions. It can help track revenue growth, identify areas of high expenses, analyze profit margins, and ensure sufficient cash flow to meet operational needs. By regularly monitoring this financial dashboard, executives can effectively manage the organization’s financial health and take proactive steps to address any issues that may arise.
- Sales Dashboard: An executive dashboard for sales would include key metrics such as sales figures, conversion rates, customer acquisition cost, and sales team performance. This dashboard provides a high-level overview of the sales department’s effectiveness and allows executives to track progress towards sales goals. Additionally, it can help identify areas for improvement and make data-driven decisions to optimize sales strategies.
- Marketing Dashboard: This executive dashboard provides a snapshot of important marketing metrics to help evaluate the effectiveness of your marketing campaigns. It allows you to track website traffic, leads generated, conversion rates, and campaign performance all in one place. With this information, you can easily see what’s working and what may need adjustments to optimize your marketing strategy.
- HR Dashboard: This HR dashboard example provides key metrics and data to monitor the performance and effectiveness of the HR department within an organization. It includes information on employee turnover, recruitment metrics, training programs, and overall workforce statistics. By tracking these metrics, HR executives can gain valuable insights into the health and efficiency of the workforce, identify areas for improvement, and make data-driven decisions to optimize HR operations.
- Customer Dashboard: Executive dashboards and reporting are crucial tools for organizations to track key performance indicators and make informed decisions. One example of a customer dashboard includes tracking customer satisfaction, retention rates, churn rates, and average response time to measure the overall customer experience. By analyzing this data, organizations can identify areas for improvement and make strategic decisions to enhance customer satisfaction and loyalty.
- Operational Dashboard: Having an operational dashboard provides key insights into the performance of your organization’s production output, efficiency metrics, product quality, and supply chain performance. By utilizing this tool, you can optimize operations, identify areas for improvement, and make data-driven decisions to drive success. This dashboard allows executives to have a comprehensive view of the operational aspects of the business and ensure that goals are being met effectively and efficiently.
- Project Management Dashboard: This type of dashboard provides a quick overview of key project metrics, allowing executives to easily see where things stand at a glance. It helps in identifying potential bottlenecks, areas of concern, or opportunities for improvement. With this information readily available, decision-making becomes more informed and efficient, leading to better project outcomes.
- Quality Management Dashboard: This dashboard provides a comprehensive overview of the quality customer relationship management process within an organization. By tracking key metrics such as defect rates, customer complaints, supplier performance, and product quality, executives can quickly identify areas that need improvement and take proactive steps to address any issues. This dashboard is essential for maintaining high standards of quality and ensuring customer satisfaction.
- IT Dashboard: The IT dashboard provides a real-time snapshot of critical IT performance metrics, allowing executives to quickly identify any issues and make smarter decisions to ensure the smooth operation of their organization’s IT infrastructure. This type of dashboard is essential for keeping executives informed about the performance and security of their technology systems, enabling them to address any issues promptly and effectively.
- Executive Scorecard: This executive dashboard is designed to give leaders a quick and easy way to grasp the overall performance of the organization. It includes key metrics from different departments, providing a comprehensive view of how well the organization is doing in achieving its goals. With this dashboard, executives can quickly identify areas that need attention and make informed business decisions to drive success.
- CEO Dashboard: This dashboard provides a high-level overview of the organization’s performance and progress towards its goals. It may include metrics such as revenue growth, donor retention rates, program impact, and other key performance indicators. The CEO dashboard is designed to give the CEO quick and easy access to the information they need to make informed decisions and steer the organization towards success.
- Strategic Dashboard: Strategic dashboards are designed to provide high-level insights and key performance indicators to help executives make informed decisions. These dashboards typically focus on overall organizational performance and may include metrics such as revenue, expenses, and fundraising goals. By presenting this information in a visually appealing and easy-to-understand format, executives can quickly assess the health of the organization and identify areas that may need attention.
- Individual Dashboard: These individual dashboards provide executives with a snapshot of key metrics and performance indicators that are relevant to their specific roles and responsibilities. By customizing the information presented on these dashboards, executives can quickly and easily access the data they need to make informed decisions and track progress towards their goals. This level of personalization can help ensure that each executive has the information they need to effectively oversee their area of the organization and drive successful outcomes.
Executive dashboards come in various types to cater to different audiences, each serving a specific purpose and communicating relevant data to support decision-making.