
In today’s hyper-competitive retail environment, assortment optimization is no longer an operational afterthought—it is a strategic growth engine. Leading retailers use data scraping systems, POS data, customer data, and analytics dashboards to continuously refine product selection, category management, and customer demand forecasting.
The global assortment strategy market reached USD 2.1 billion in 2024, confirming that retailers increasingly rely on data analytics, AI, and machine learning algorithms to improve gross margin, on-shelf availability, and retail success.
This article series explores real-world assortment optimization examples from Walmart, Amazon & more, showing how companies transform raw data into actionable dashboards that drive decisions across retail operations, inventory management, and customer engagement.
🧠 Beyond Products: What Modern Assortment Optimization Really Means 🧠
Modern assortment optimization goes far beyond deciding what to stock. It is a systemic process that connects:
- Customer preferences & shopper behavior
- Seasonal trends & regional preferences
- Sales velocity & share capture
- Inventory signals (overstock situations, shelf flow, shelf placement)
At its core, it aligns customer demand with business goals, ensuring the right product depth and width at the right time, place, and price.
Retailers that succeed treat assortment optimization as a living system, continuously updated through data scraping, market research, and dashboard-driven insights, not static annual planning.
🏆 Why Leading Retailers Master Their Product Mix 🏆
Top retailers understand that product mix optimization directly impacts:
- Customer loyalty and repeat purchases
- Inventory efficiency and reduced stockouts
- Gross margin growth and profitability
A well-optimized assortment minimizes product cannibalization, avoids slow movers, and protects on-shelf availability for high-demand SKUs. According to Bain & Company, retailers using advanced data analytics grew revenue 2× faster and profits 4× faster than competitors between 2020–2023.
This is why leaders invest heavily in AI-driven dashboards, combining POS data, customer demographics, and consumer decision trees to support daily decisions.
🧩 Core Principles of an Effective Assortment Strategy 🧩
Every successful assortment strategy is built on a few non-negotiable foundations:
- Customer-centricity – understanding customer behavior, engagement, and loyalty drivers
- Data discipline – consistent use of sales data, customer data, and demand forecasting
- Category clarity – strong category management and localized assortment logic
These principles ensure the assortment supports both retail operations and long-term category growth, rather than short-term sales spikes.
Breadth, Depth & Product Mix Explained 🛒
- Breadth – number of categories offered (e.g., mass retailers like Walmart)
- Depth – number of SKUs within a category (e.g., specialty or CPG retailers)
- Product mix – the strategic balance between the two
Optimizing these dimensions improves sales velocity, shelf space efficiency, and planogram dimensions, while protecting gross margin. The goal is not “more products,” but better-performing products.
🤖 The Role of Data, Analytics & AI in Assortment Planning 🤖
Assortment optimization at scale is impossible without advanced analytics and AI. Modern systems integrate:
- Demand forecasting models
- Machine learning algorithms for SKU performance prediction
- Customer segmentation & localized assortment logic
AI-driven dashboards allow retailers to simulate what-if scenarios, detect overstock situations, and optimize product distribution across store clusters. This shift—from intuition to intelligence—is the backbone of data-driven retail success.
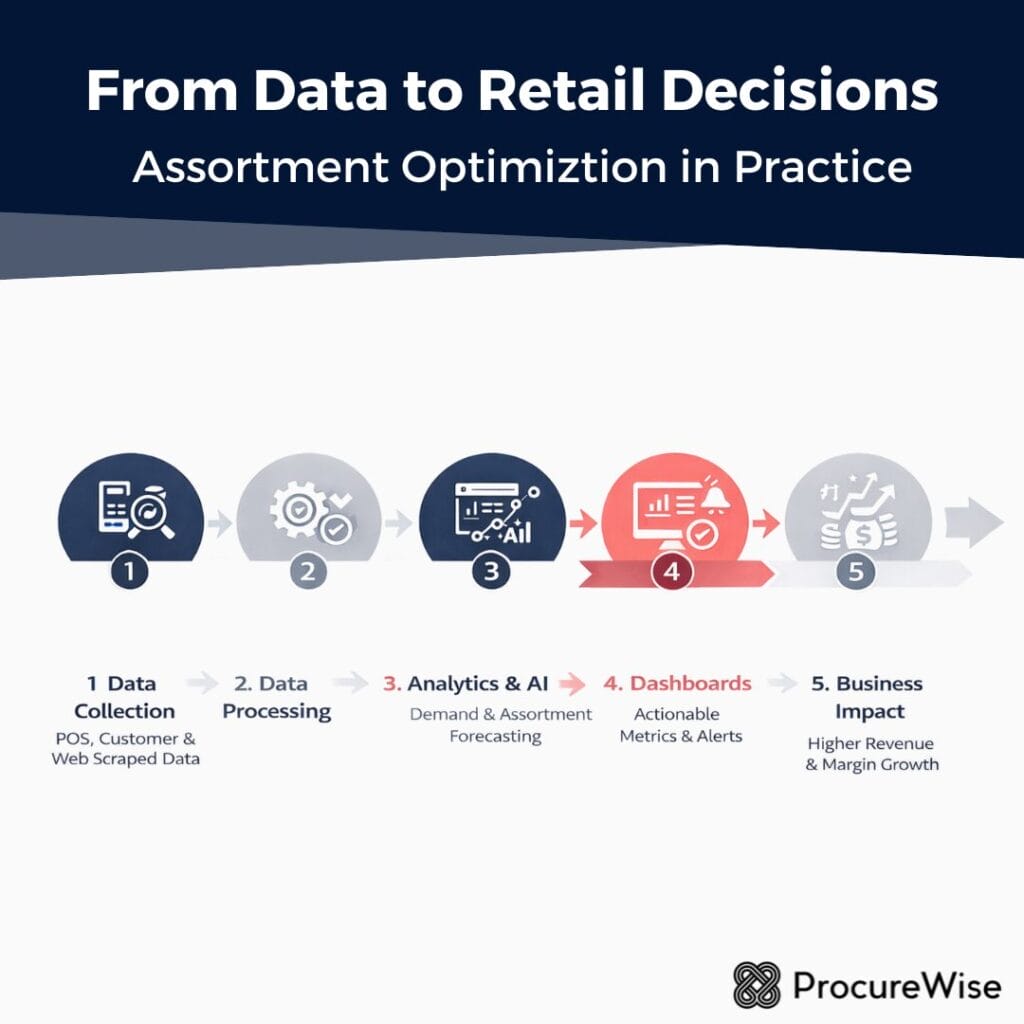
From Data Scraping to Actionable Dashboards 📈
Data scraping systems collect signals from:
- POS systems
- E-commerce platforms
- Marketplaces & competitors
- Social media (when relevant)
These inputs feed centralized dashboards that support real-time decisions on product selection, retail operations, and inventory optimization—turning raw data into clear, operational actions.
🟦 Walmart vs. Amazon: Two Models of Assortment Optimization 🟦
From Strategy to Scale: Why Walmart and Amazon Took Different Paths 🧭
Although Walmart and Amazon both lead global retail, their assortment optimization systems evolved in fundamentally different ways. What unites them is extreme data maturity; what differentiates them is how data is operationalized across retail operations, category management, and customer engagement.
Both companies rely on data scraping, POS data, demand forecasting, and AI, but they apply them to distinct business realities:
- Walmart → physical scale + regional complexity
- Amazon → digital scale + infinite choice
Understanding these two models is critical when designing scraping systems and dashboards inside your own organization.
🟩 Walmart: Mass Scale with Hyper-Localized Precision 🟩
Walmart operates one of the most complex assortment ecosystems in the world. Its strength lies in combining standardization with local adaptation, driven by granular data and operational discipline.
The EDLP Assortment Logic (Everyday Low Price) 🏷️
At the core of Walmart’s product selection is EDLP (Everyday Low Price). This directly shapes assortment decisions:
- Focus on high-demand, high-velocity SKUs
- Preference for products with stable demand forecasting
- Tight control over gross margin and inventory turnover
Dashboards here emphasize:
- Sales velocity
- On-shelf availability
- Overstock situations
- POS data anomalies
The goal is simple: never break availability on core items.
Hyper-Localization via Store Clustering 🌍
Despite its scale, Walmart localizes aggressively. Using customer demographics, regional preferences, and shopper behavior, stores are grouped into clusters with tailored assortments.
Examples of dashboard-driven decisions:
- Product depth adjusted by store cluster
- Seasonal trends localized by geography
- Assortment gaps flagged via customer demand signals
This model reduces product cannibalization and improves share capture at the local level.
Supply Chain as an Assortment Lever 🚚
For Walmart, supply chain = assortment strategy.
If the supply chain cannot support an SKU at scale, it does not belong in the assortment. Dashboards tightly connect:
- Inventory management
- On-shelf availability
- Product distribution
- Retail operations KPIs
This is why Walmart dashboards are deeply operational—not just analytical.
Category Management at Massive Scale 🗂️
Walmart’s category management systems evaluate:
- SKU performance by store, cluster, region
- Shelf flow and shelf placement efficiency
- Category growth vs. space allocation
AI helps automate decisions that humans cannot make at this scale—especially around planogram dimensions and shelf flow optimization.
🟧 Amazon: The Endless Aisle & Algorithmic Assortment 🟧
Amazon’s model is the opposite of Walmart’s. There are no physical shelf limits—only attention limits.
The “Endless Aisle” Philosophy 🛒
Amazon optimizes not for shelf space, but for discoverability.
Assortment decisions are driven by:
- Search behavior
- Click-through rates
- Conversion data
- Reviews and ratings
- Market research signals
Here, data scraping (marketplaces, competitors, pricing) is foundational.
AI-Driven Dynamic Assortment 🤖
Amazon does not present the same assortment to every customer.
Using machine learning algorithms, Amazon dynamically:
- Ranks products per user
- Suppresses low-performing SKUs
- Promotes high-margin or high-demand items
Dashboards track:
- Customer engagement
- Consumer decision tree paths
- Demand transference between products
This reduces decision fatigue while preserving massive assortment depth.
Assortment Rationalization at Digital Scale ✂️
Even with millions of SKUs, Amazon continuously removes products.
Signals include:
- Low sales velocity
- Poor customer feedback
- Margin erosion
- High operational cost
This is assortment rationalization, not limitation. The objective is to protect customer experience and gross margin.
Omnichannel Expansion: Digital Meets Physical 🔁
With Whole Foods and Amazon Go, Amazon now merges:
- Online customer data
- Physical POS data
- Localized assortment logic
Dashboards unify digital and physical worlds, enabling:
- Localized assortment
- Smarter product distribution
- Improved customer loyalty
🔍 What These Models Teach Your Organization 🔍
Despite their differences, Walmart and Amazon share key principles relevant to any company building scraping systems and dashboards:
- Assortment optimization is continuous, not annual
- Dashboards must be decision-oriented, not descriptive
- AI only works when fed with clean, structured data
- Localization beats one-size-fits-all
Most importantly: technology follows strategy, not the other way around.
🟪 From Consultation to System Design: Building Scraping Pipelines & Dashboards 🟪
Why Most Retail Dashboards Fail 🚨
Many companies invest in data scraping systems, BI tools, and AI models, yet decision-makers still rely on Excel or intuition. The reason is simple: dashboards are often built without understanding real retail decisions.
Successful assortment optimization systems start before any code is written—at the consultation and diagnostic stage.
🧩 Step 1: Diagnostic & Business Consultation 🧩
Before designing pipelines or dashboards, leading retailers answer three critical questions:
- Which decisions must improve? (product selection, overstock situations, shelf placement)
- Who makes them? (category managers, supply chain, retail operations)
- How often? (daily, weekly, seasonal)
This step aligns data analytics with retail success, preventing over-engineering and unused dashboards.
Decision Mapping Instead of KPI Overload 🧠
Rather than tracking dozens of KPIs, best-in-class systems map:
- Decision → Required insight → Data source → Dashboard view
Example:
- Decision: Remove underperforming SKUs
- Insight: Low sales velocity + margin erosion
- Data: POS data, customer demand, gross margin
This approach ensures dashboards directly support category management and assortment rationalization.
🧱 Step 2: Data Architecture & Scraping Design 🧱
Once decisions are defined, data architecture follows.
Core Data Sources in Retail Analytics 🗃️
Most effective assortment systems combine:
- POS data (sales velocity, basket composition)
- Customer data (demographics, loyalty, engagement)
- Product data (width, depth, cannibalization risk)
- External data scraping:
- Competitor pricing
- Online assortment depth
- Promotions & availability
- Market research signals
Scraping fills blind spots traditional systems cannot see.
Designing Scraping Pipelines That Scale ⚙️
Key principles:
- Scrape only decision-relevant data
- Normalize early (SKU IDs, categories, class of trade)
- Validate data quality automatically
Well-designed pipelines reduce noise and support machine learning algorithms downstream.
🧠 Step 3: Analytics & AI Layer 🧠
This layer transforms raw data into actionable intelligence.
Demand Forecasting & Sales Velocity Models 📈
Models typically focus on:
- Baseline demand
- Seasonal trends
- Promo uplift
- Regional preferences
Outputs feed dashboards used by retail operations and inventory management teams.
Assortment Optimization & Rationalization Models ✂️
AI supports:
- SKU add/remove recommendations
- Product cannibalization detection
- Category growth simulations
- Localized assortment optimization
These models directly improve gross margin and reduce overstock situations.
Customer-Centric Intelligence 🎯
Machine learning enhances:
- Customer segmentation
- Consumer decision tree modeling
- Demand transference analysis
- Personalized assortment logic
This connects assortment decisions to customer loyalty and customer engagement.
📊 Step 4: Dashboard Design That Drives Action 📊
Dashboards must answer one question per screen.
Operational vs. Strategic Dashboards ⚖️
- Operational dashboards
- On-shelf availability
- Shelf flow issues
- Stockout & overstock alerts
- Strategic dashboards
- Product mix health
- Category management performance
- Share capture & margin trends
Mixing both creates confusion and low adoption.
Role-Based Views 👥
Effective systems provide:
- Category manager view
- Supply chain view
- Executive summary view
Each uses the same data, filtered by decision context.
🔄 Step 5: From Insight to Action 🔄
Dashboards alone do not change behavior.
High-performing retailers embed:
- Alerts
- Threshold-based recommendations
- Workflow integration (JIRA, email, Slack)
This closes the loop between data analytics and retail operations.
🟧 Measuring ROI, Scaling & Avoiding Assortment Optimization Traps 🟧
Why Assortment Optimization Must Prove ROI 💰
Even the best data scraping systems and dashboards will be questioned if they do not clearly impact profitability. Leading retailers therefore treat assortment optimization as an investment, not an IT cost.
ROI must be visible across:
- Gross margin improvement
- Inventory reduction
- Sales velocity uplift
- Customer loyalty growth
If results cannot be measured, the system will not scale.
📊 Step 6: Defining the Right Success Metrics 📊
Effective measurement starts with few, decision-linked metrics, not vanity KPIs.
Core KPIs That Actually Matter 📈
Retail leaders track:
- Gross margin by category & SKU
- Sales velocity before vs. after assortment changes
- On-shelf availability improvements
- Overstock situations reduction
- Share capture at category level
These metrics directly connect product selection decisions to financial outcomes.
Before–After Logic (The Retail A/B Test) 🧪
Smart teams compare:
- Store clusters with optimized assortments vs. control groups
- Seasonal performance vs. historical baseline
- Localized assortment vs. national standard
This isolates the true impact of data-driven decisions.
📈 Step 7: Scaling the System Without Breaking It 📈
Once value is proven, scale becomes the challenge.
From Pilot to Enterprise Rollout 🏗️
Successful scaling follows this order:
- One category
- One region or cluster
- One decision type (e.g. SKU removal)
- Full assortment optimization
This avoids overwhelming retail operations and protects adoption.
Standardization + Localization Balance ⚖️
Scaling does not mean uniformity.
Best systems allow:
- Global rules (margin thresholds, service levels)
- Local overrides (regional preferences, store constraints)
This balance is critical for localized assortment success.
🚨 Common Assortment Optimization Pitfalls 🚨
Even advanced retailers repeat the same mistakes.
Pitfall 1: Too Much Data, Too Little Action ❌
Collecting customer data, social media signals, and market data without a clear decision framework leads to dashboard fatigue.
Fix: Tie every metric to a specific decision owner.
Pitfall 2: Ignoring Shelf & Physical Constraints 🧱
Assortment models often fail when they ignore:
- Shelf placement
- Product width & depth
- Planogram dimensions
- Shelf flow
Digital logic must respect physical reality.
Pitfall 3: Fear of Assortment Rationalization ✂️
Many organizations hesitate to remove SKUs.
Reality:
- Fewer SKUs often increase sales velocity
- Reduced complexity improves on-shelf availability
- Customer choice improves when noise is removed
Assortment rationalization is a growth lever, not a risk.
Pitfall 4: Treating AI as a Black Box 🤖
When teams do not understand model logic, trust disappears.
Fix:
- Explain drivers (margin, demand, cannibalization)
- Keep humans in the loop
- Use AI for recommendations, not commands
🔁 Long-Term Impact: From Optimization to Competitive Advantage 🔁
When executed correctly, assortment optimization becomes a strategic moat.
Long-term benefits include:
- Faster reaction to market trends
- Stronger customer engagement
- Higher customer loyalty
- Sustainable category growth
Retailers evolve from reactive merchants to predictive organizations.
🌍 The Future: Where Assortment Optimization Is Heading 🌍
Next-generation systems will combine:
- Real-time data scraping
- Generative AI insights
- Automated decision workflows
- Predictive scenario modeling
This enables mass personalization while maintaining operational efficiency.