
Understanding the range of products you offer and the pricing strategies you implement are crucial components of your business’s profitability. But how do you reliably assess whether your product range and pricing are on the right track?
By focusing on key performance indicators (KPIs) related to your product range and price, you can gain insights into your business’s financial health and make data-driven decisions. These KPIs can help you identify which products drive the most revenue, how pricing adjustments impact sales, and where you might have opportunities for optimizing your offerings to better meet market demands.
When monitored correctly, product range and price KPIs can reveal a wealth of information about consumer behavior, market trends, and competitive positioning. In this guide, we’ll explore essential product and pricing KPIs that help forecast profitability, providing you with actionable insights to refine your strategies and enhance your bottom line.
✨ Understanding Product Range & Price KPIs ✨
The Power of Data-Driven Decisions ▶️
In today’s competitive environment, data is the engine of profitable growth. When you understand how each product and each price point contributes to your bottom line, KPIs stop being numbers and become actionable insights. They reveal which items strengthen your margin, where pricing leaks occur, and how to adjust your assortment for maximum profitability.
Why Profitability Matters More Than Revenue ▶️
Revenue shows how much you sell, but profitability shows how well you sell it. A company can scale fast and still lose money if product costs, pricing, or portfolio structure are misaligned. Profitability KPIs give a true financial picture, showing whether your product range and pricing strategy fuel sustainable growth.
A Glimpse at the 9 KPIs You Should Track ▶️
The essential profitability KPIs fall into three categories:
- Core Profitability – margins that show how efficiently products generate profit
- Operational Efficiency – metrics showing how smoothly the business turns products into cash
- Customer Value – indicators revealing how your pricing and range impact long-term loyalty and revenue
Together, they create a holistic profitability dashboard that helps you optimize both product mix and pricing strategy.
KPI Basics: Why They Matter for Your Business ▶️
A KPI is more than a metric—it’s a direct link to a strategic goal. While a metric shows activity, a KPI shows performance that drives results. For product and price management, KPIs help you understand:
- which products deliver the highest return,
- whether your pricing supports or erodes margin,
- how your financial health evolves as the market changes.
They turn raw data into a clear path toward smarter pricing, stronger margins, and a more profitable product portfolio.
✨ The Core Profitability KPIs That Shape Your Pricing Power ✨
KPI 1: Gross Profit Margin (GP%) ▶️
What it shows: How efficiently your products generate profit before overheads. Why it matters for product & price: GP% instantly reveals whether your pricing structure and COGS management are aligned. A drop often signals rising production costs or pricing pressure. Formula: (Revenue – COGS) / Revenue × 100 Key insight: Strong GP% = healthy unit economics and pricing strength.
KPI 2: Operating Profit Margin (OPM) ▶️
What it shows: Profitability after operating expenses. Why it matters: OPM connects product margin with operational efficiency, showing whether overheads dilute the value created by your product range. Formula: Operating Income / Revenue × 100 Key insight: Stable OPM means your cost structure supports your pricing strategy.
KPI 3: Net Profit Margin (NPM) ▶️
What it shows: The true bottom line after all expenses. Why it matters: Even strong products can’t save weak overall profitability. NPM shows how well product mix + pricing + cost control work together. Formula: Net Income / Revenue × 100 Key insight: Improving NPM signals your entire pricing system is becoming more profitable.
✨ Operational Efficiency KPIs That Boost Cash & Flexibility ✨
KPI 4: Cash Conversion Cycle (CCC) ▶️
What it shows: How fast you turn inventory into cash. Why it matters: Product range decisions affect stock levels, and pricing affects sales velocity. A shorter CCC means quicker monetization of your assortment. Formula: DIO + DSO – DPO Key insight: Lower CCC = less capital locked in products.
KPI 5: Return on Assets (ROA) ▶️
What it shows: How effectively assets generate profit. Why it matters: Large assortments require storage, systems, and capital. ROA reflects whether your product range is earning more than it costs to maintain. Formula: Net Income / Total Assets Key insight: Higher ROA = efficient use of resources supporting the product portfolio.
KPI 6: Return on Equity (ROE) ▶️
What it shows: Profit returned to owners. Why it matters: Strong product and pricing strategies drive higher earnings, improving ROE. Formula: Net Income / Shareholder Equity Key insight: Consistently strong ROE signals long-term value creation.
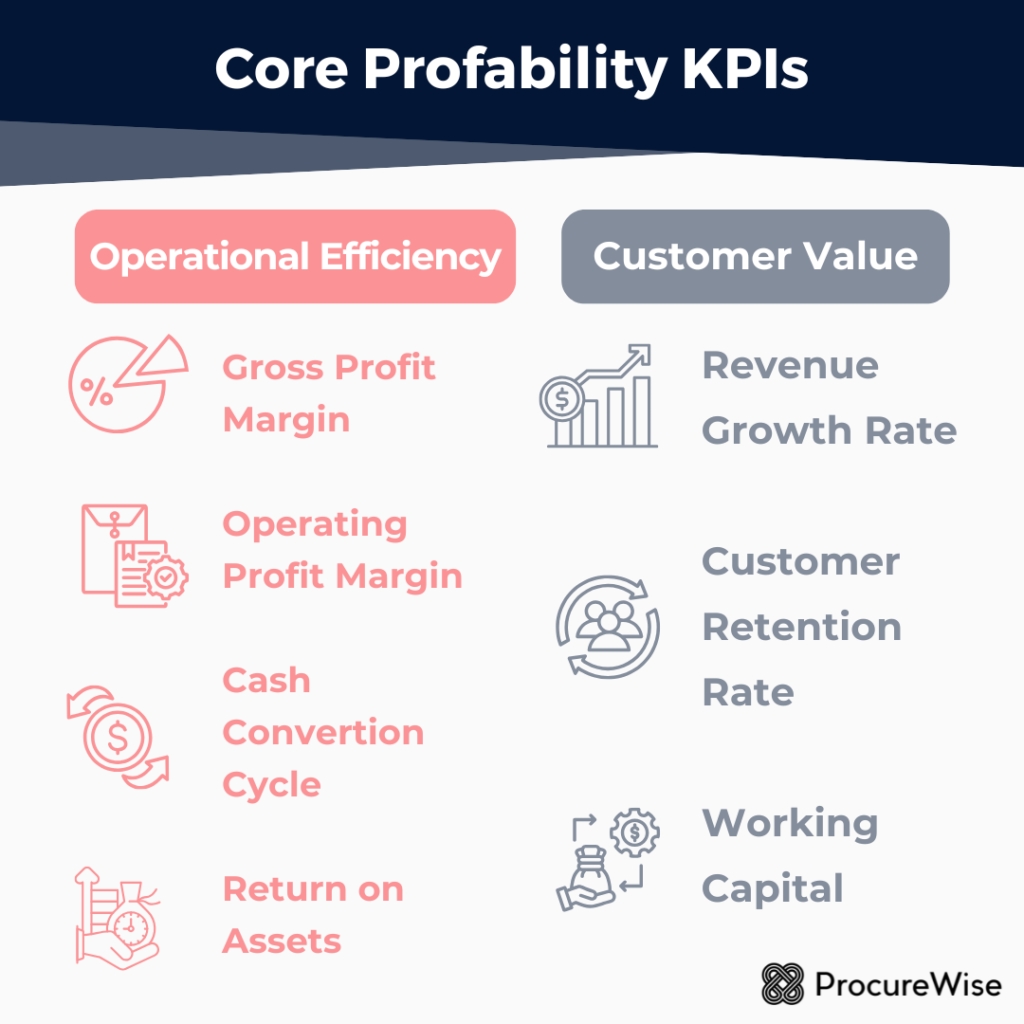
✨ Growth & Customer Value KPIs That Strengthen Your Pricing Strategy ✨
KPI 7: Revenue Growth Rate ▶️
What it shows: How fast your revenue increases over time. Why it matters: Growth indicates that your product range resonates and your prices match market demand. But growth must be read alongside margins to ensure it’s profitable growth. Formula: ((Current – Previous Revenue) / Previous Revenue) × 100 Key insight: Healthy growth is valuable only when it supports profitability, not drains it.
KPI 8: Customer Retention Rate (CRR) ▶️
What it shows: How many customers stay with you over time. Why it matters: Customer loyalty reduces acquisition costs and stabilizes revenue. High CRR often signals strong perceived value, meaning customers accept your pricing and appreciate your assortment. Formula: ((Ending Customers – New Customers) / Starting Customers) × 100 Key insight: Retention is one of the best long-term drivers of profitable pricing.
KPI 9: Working Capital (Current Ratio) ▶️
What it shows: Your ability to pay short-term obligations. Why it matters: A solid liquidity position ensures you can invest in inventory, pricing tests, and product innovation without financial strain. Formula: Current Assets / Current Liabilities Key insight: A ratio above 1.0 indicates stability that supports a strong product strategy.
✨ How These KPIs Create a Unified Profitability Picture ✨
The Interdependence Behind Your Product & Price Decisions ▶️
Each KPI tells part of the story — but together they reveal the cause-and-effect chain behind profitable pricing. Examples:
- Pushing revenue growth may reduce Net Profit Margin if marketing costs spike.
- Optimizing the Cash Conversion Cycle frees capital for expanding your product line.
- A high Gross Profit Margin paired with weak Operating Profit Margin signals operational inefficiency, not pricing issues.
The power lies in reading them as a system.
Identifying Strengths & Weaknesses in Your Portfolio ▶️
Tracking these KPIs over time helps you detect:
- which products are margin leaders or margin killers,
- where pricing is too aggressive or too soft,
- whether operations support or hinder profitability.
This insight lets you allocate resources precisely where they deliver the strongest financial impact.
✨ Implementing KPIs for Continuous Pricing & Product Improvement ✨
Setting Realistic Goals & Benchmarks ▶️
Each KPI must be tied to a clear, measurable target. Industry benchmarks help you understand whether your margins, pricing power, and product efficiency are competitive. A “good” Net Profit Margin or CCC differs across sectors — context is everything. Aim for goals that stretch your team without breaking operational reality.
Choosing the Right Tools for Tracking ▶️
You can start with simple spreadsheets, but as your product range grows, advanced dashboards (e.g., Scorecard, ClearPoint) help you:
- automate data collection,
- visualize price & margin trends,
- share insights across teams.
Accurate, accessible data ensures faster and better pricing decisions.
Regular Review & Adjustment ▶️
KPIs should guide an ongoing strategic cycle — not a once-a-year check. Monthly or quarterly reviews should focus on:
- trend analysis,
- identifying margin leaks,
- adjusting product mix,
- optimizing prices based on evidence.
This rhythm turns KPIs into a living decision system.
Building a Data-Driven Culture ▶️
For KPIs to influence profitability, the whole organization must understand them. Make performance transparent. Show how each role contributes to product and pricing success. When teams align around KPIs, decisions become coherent, objective, and profit-oriented.