
In today’s fast-paced business environment, having the right insights at your fingertips is crucial for effective decision-making. This is where industry-specific executive dashboards come into play. Designed to cater to the unique metrics and key performance indicators (KPIs) of specific sectors, these dashboards provide a tailored view of your organization’s performance, allowing leaders to make informed decisions quickly.
Whether you’re in retail, healthcare, finance, or manufacturing, a well-crafted executive dashboard synthesizes critical data points and visualizes them in a user-friendly format. These dashboards enable executives to monitor trends, track progress towards goals, and identify areas that require immediate attention. By focusing on the metrics that matter most to your industry and organization, executive dashboards eliminate the noise and help you zero in on what drives success.
In this guide, we’ll explore the concept of industry-specific executive dashboards, understand their importance, and provide examples to illustrate their effectiveness. We’ll also discuss best practices for creating dashboards that provide actionable insights, ensuring you have the tools you need to steer your organization towards success. Get ready to revolutionize your strategic planning and execution with the power of data visualization—let’s dive in!
💡 Understanding Executive Dashboards 💡
Executive dashboards, in general, are visual interfaces that provide a top-level overview of an organization’s performance metrics. These dashboards are designed to present complex data in a simplified and accessible format, enabling executives to quickly understand and assess key areas such as financial health, operational efficiency, customer satisfaction, and growth trends.
However, traditional dashboards are often generic in nature, lacking the granularity and specificity required to address the intricacies of particular industries. Industry-specific dashboards take this a step further by offering a more focused view, with metrics that align closely with the priorities, regulations, and market forces unique to a given industry.
For example, a manufacturing dashboard might focus on metrics like production efficiency, inventory turnover, and equipment downtime, while a healthcare dashboard might prioritize patient satisfaction, treatment efficacy, and regulatory compliance.
⛔ Key Differences Between General and Industry-Specific Dashboards ⛔
Industry-specific executive dashboards are distinguished from their general counterparts in several key ways:
📌 Tailored Metrics: Instead of relying on broad KPIs, industry-specific dashboards prioritize metrics directly relevant to the industry. For instance, a financial services dashboard may include metrics like loan delinquency rates and net interest margin, while a retail dashboard might emphasize average transaction value and customer footfall.
📌 Regulatory Compliance: Certain industries, such as healthcare and finance, operate under strict regulatory guidelines. Industry-specific dashboards can incorporate compliance indicators, helping executives monitor adherence to relevant laws and standards. This not only ensures better regulatory compliance but also mitigates risk.
📌 Customized Visualizations: Dashboards tailored to a specific industry often utilize visualization formats that best represent industry-specific data. For instance, supply chain dashboards may incorporate maps to show real-time shipping routes and statuses, while manufacturing dashboards might feature Gantt charts to track production timelines.
📌 Strategic Alignment: Industry-specific dashboards are designed with the strategic goals and challenges of the industry in mind. By focusing on the key drivers that impact industry performance, these dashboards provide executives with a clear view of their organization’s progress toward strategic objectives.
✅ Benefits of Industry-Specific Executive Dashboards ✅
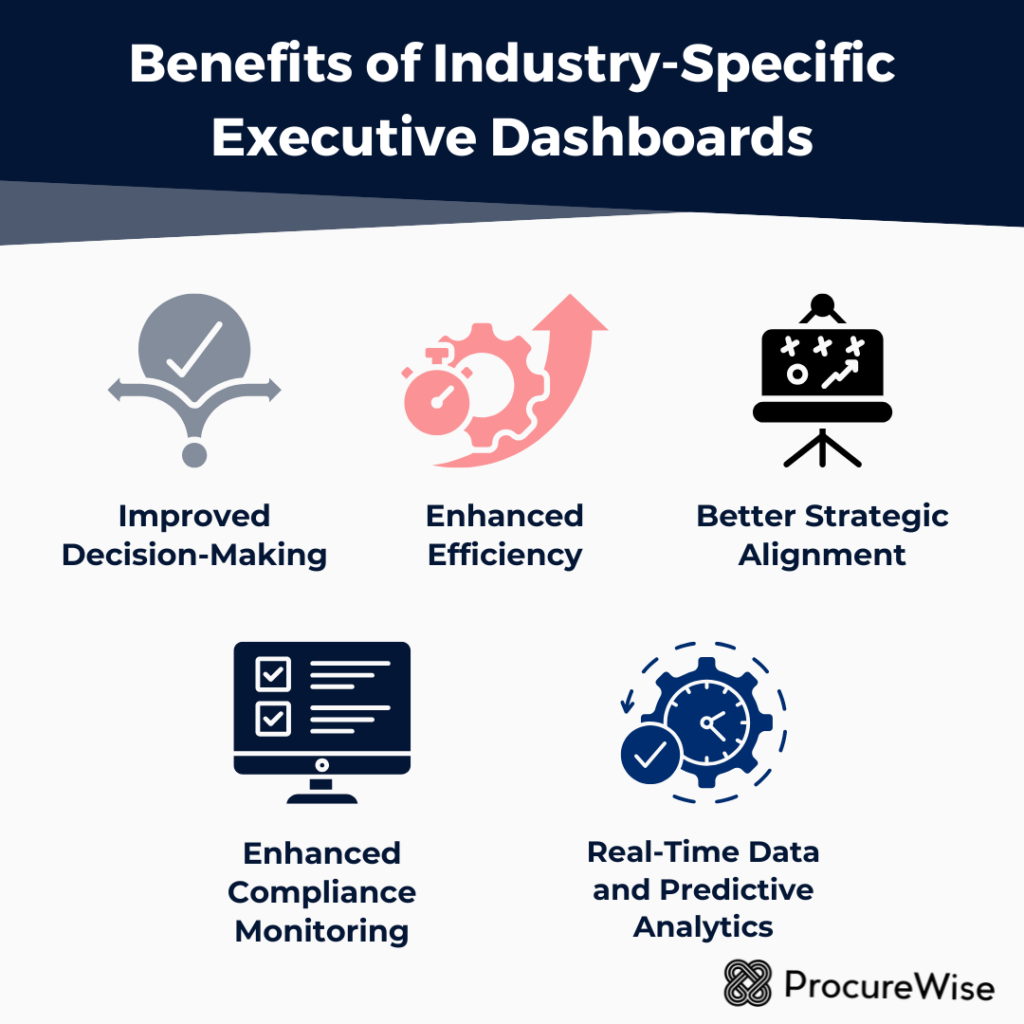
Industry-specific executive dashboards offer numerous benefits that enhance decision-making and operational efficiency:
✔️ Improved Decision-Making: By focusing on industry-relevant metrics, these dashboards enable executives to make more accurate and timely decisions. For example, a retail executive can use a dashboard to identify declining sales in a specific region, adjust inventory, and launch promotional campaigns. The quick insights offered by these dashboards allow decision-makers to respond to challenges and capitalize on opportunities promptly.
✔️ Enhanced Efficiency: Dashboards that focus on industry-specific processes help in pinpointing inefficiencies within those processes. For instance, a logistics dashboard may reveal bottlenecks in the supply chain, enabling logistics managers to address issues quickly and avoid costly delays. By streamlining operations, companies can reduce overhead and improve productivity.
✔️ Better Strategic Alignment: Industry-specific dashboards are aligned with an organization’s goals within the context of its industry. This helps executives ensure that their teams and resources are focused on the right objectives. For example, a healthcare dashboard that tracks patient outcomes aligns with the healthcare organization’s goal of providing quality care, while a financial institution might prioritize risk assessment and compliance.
✔️ Enhanced Compliance Monitoring: Certain industries have rigorous regulatory requirements. Industry-specific dashboards integrate compliance indicators that enable organizations to monitor regulatory adherence in real time. For example, in the finance sector, a dashboard may track anti-money laundering (AML) compliance metrics, while in healthcare, HIPAA compliance can be monitored closely.
✔️ Real-Time Data and Predictive Analytics: Industry-specific dashboards leverage real-time data and predictive analytics to offer deeper insights. For instance, in manufacturing, predictive maintenance alerts can notify operators before equipment failures occur, minimizing downtime. Real-time data enables executives to make proactive decisions, staying ahead of potential disruptions.
📚 Examples of Industry-Specific Dashboards Across Sectors 📚
Each industry has unique needs and operational priorities that require tailored metrics and insights. Here are examples of how industry-specific dashboards work across various sectors:
Healthcare 🚑
Healthcare organizations rely heavily on data to improve patient care and operational efficiency. A healthcare executive dashboard might include metrics such as:
➡️ Patient Satisfaction Scores: Provides insights into patient experience, helping hospitals make improvements in care delivery.
➡️ Readmission Rates: Tracks the number of patients returning for additional treatment, which can indicate the quality of care.
➡️ Treatment Costs and Utilization Rates: Monitors resource allocation and helps manage costs.
These metrics allow healthcare executives to optimize resource allocation, improve patient outcomes, and ensure compliance with healthcare regulations.
Retail 🛒
Retailers benefit from dashboards that offer insights into sales trends, inventory levels, and customer behavior. Key metrics in a retail-specific dashboard might include:
👉 Sales Per Square Foot: Assesses how effectively retail space is generating revenue.
👉 Average Transaction Value: Measures the average amount customers spend per transaction.
👉 Customer Retention Rate: Tracks how many customers return for repeat purchases.
By analyzing these metrics, retail executives can make data-driven decisions on product assortment, store layout, and promotional strategies.

Manufacturing ⚙️
Manufacturing executives need to monitor production efficiency, equipment status, and supply chain dynamics. Key metrics in a manufacturing dashboard might include:
➡️ Overall Equipment Effectiveness (OEE): A key indicator of manufacturing efficiency, measuring how well equipment is being utilized.
➡️ Production Yield: Tracks the percentage of products produced without defects.
➡️ Supply Chain Lead Time: Monitors the time taken to procure and deliver materials.
These metrics provide a comprehensive view of the production process, enabling manufacturers to improve productivity, reduce waste, and ensure timely delivery of products.
Finance 💵
In the financial sector, executives need insights that help them manage risk, comply with regulations, and maximize profitability. A finance-specific dashboard might include:
👉 Net Interest Margin: Measures the difference between interest income and expenses, an important profitability metric.
👉 Loan Delinquency Rates: Tracks the percentage of loans not paid on time, which indicates credit risk.
👉 Compliance Score: Assesses how well the organization adheres to regulatory requirements.
By focusing on these metrics, financial executives can optimize lending practices, improve profitability, and ensure regulatory compliance.
Logistics and Supply Chain 📦
For logistics and supply chain managers, a dashboard that tracks shipment status, inventory levels, and warehouse performance is essential. Key metrics might include:
➡️ On-Time Delivery Rate: Measures the percentage of orders delivered on time.
➡️ Inventory Turnover Ratio: Assesses how quickly inventory is sold and replaced, indicating supply chain efficiency.
➡️ Freight Cost per Mile: Monitors shipping costs, which is crucial for budgeting and cost control.
These metrics help logistics managers identify inefficiencies, reduce costs, and improve overall supply chain performance.
🥊 Challenges and Considerations 🥊
While industry-specific dashboards offer numerous benefits, they come with challenges that organizations must consider:
📢 Data Integration: Many organizations rely on multiple systems that generate data. Integrating these systems to provide a cohesive view on a dashboard can be challenging, particularly in industries with complex data sources.
📢 Data Privacy and Security: In sectors such as healthcare and finance, data privacy is paramount. Organizations need to ensure that their dashboards comply with privacy laws and protect sensitive information.
📢 Cost of Customization: Developing a highly customized, industry-specific dashboard can be expensive and resource-intensive. Organizations need to weigh the costs against the potential benefits and ROI.
📢 Employee Training: Executives and team members must understand how to interpret and use dashboard data effectively. Training staff to understand and leverage dashboards may require time and resources.
Industry-specific executive dashboards have become indispensable tools for modern organizations, providing real-time insights and tailored metrics that drive strategic decision-making and operational excellence. By focusing on the unique priorities and challenges of specific industries, these dashboards enable executives to respond quickly to changing conditions, ensure regulatory compliance, and optimize resource allocation.
From healthcare and finance to manufacturing and retail, industry-specific dashboards empower executives to stay ahead of the competition, enhance efficiency, and achieve their strategic goals. As technology continues to evolve, so too will the capabilities of these dashboards, offering even greater levels of customization, predictive analytics, and data integration. For organizations looking to thrive in a complex, data-driven world, industry-specific executive dashboards represent a critical investment in their future success.