
In the era of data-driven organizations, companies can no longer rely on static reports or manual research. To gain real competitive advantage, businesses must combine data scraping, Data Analytics, and interactive dashboards into one coherent system that supports continuous improvement and strategic decision-making.
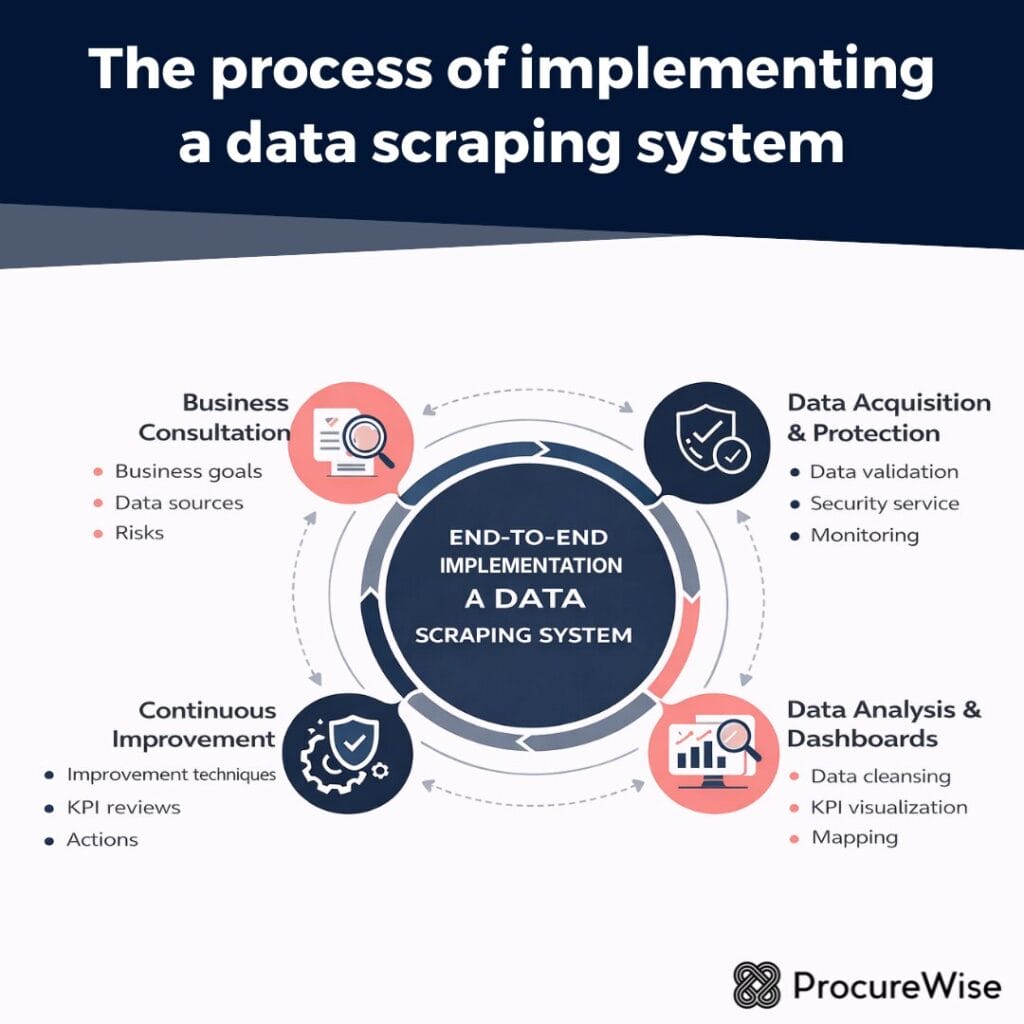
This article shows how to design and implement a data scraping system step by step — starting from business consultation, through secure data collection, Data Analysis, and finally actionable dashboards that decision-makers actually use.
🔍 From Business Consultation to Data Strategy 🔍
Understanding Business Goals and Data Needs 🎯
Every successful data initiative starts with consultation, not technology. Before writing a single SQL command or deploying a scraping script, the organization must clearly define:
- What decisions will be supported by data
- Which sources are required (internal & external)
- How often data needs to be updated
- Who will consume dashboards (management, operations, analytics teams)
This step ensures that Data Analytics aligns with real business value instead of becoming unused reports.
Mapping Data Sources and Risks 🧩
At this stage, companies identify:
- Public websites, APIs, internal systems
- Data formats and frequency
- Legal and compliance constraints
- Potential risks like malformed data, incomplete datasets, or blocked access
A proper data map prevents future rework and supports scalable Data Analysis later in the process.
🔐 Secure Data Scraping Architecture 🔐
Designing a Safe and Scalable Scraping System 🏗️
Modern data scraping must be treated as part of a security solution, not a quick script. A professional setup includes:
- Controlled scraping frequency
- Data validation layers
- Error handling for malformed data
- Logging and monitoring of each process
This approach protects both the company and the data sources while ensuring long-term stability.
Protecting Against Online Threats 🚨
Scraping systems are often exposed to:
- Online attacks
- Data poisoning
- Infrastructure abuse
- Suspicious or injected SQL command patterns
That’s why enterprise-grade scraping always integrates:
- A dedicated security service
- Input sanitization
- Access control
- Anomaly detection in incoming data
Security is not optional — it is foundational for trustworthy Data Analysis.
📈 From Raw Data to Data Analysis 📈
Cleaning, Validating, and Structuring Data 🧼
Scraped data is rarely ready to use. Before dashboards can deliver value, teams must:
- Remove duplicates
- Detect and fix malformed data
- Normalize formats
- Validate values against business rules
This step is where Data Analysis truly begins — transforming chaos into structure.
Turning Data into Actionable Insights 🔄
With clean data, organizations can apply Data Analytics to:
- Identify trends
- Monitor performance
- Detect anomalies
- Support forecasting and planning
When combined with dashboards, analytics becomes a daily operational tool — not just a monthly report.
📈 Designing Dashboards That Drive Decisions 📈
A data scraping system delivers real value only when insights are clearly visible and actionable. Dashboards are the bridge between Data Analysis and business decisions — but only if they are designed with purpose.
Choosing the Right KPIs for Business Impact 🎯
Effective dashboards focus on key performance indicators, not raw data. KPIs should be:
- Directly linked to business goals
- Easy to interpret at a glance
- Action-oriented, not descriptive only
Typical KPI categories include:
- Operational efficiency
- Market and competitor signals
- Customer behavior
- Risk and anomaly detection
This ensures Data Analytics supports decision-making instead of overwhelming users.
From Static Reports to Living Dashboards 🔄
Unlike static reports, dashboards should:
- Update automatically from scraped data
- Reflect real-time or near-real-time changes
- Enable fast reaction to market signals
Living dashboards allow organizations to move from reactive reporting to proactive management.
🧭 Value Stream Mapping with Data 🧭
Connecting Data to Business Processes 🧩
Value stream mapping helps visualize how data supports the entire business flow — from input to outcome. When combined with scraped external data and internal systems, it allows companies to:
- Identify bottlenecks
- Detect inefficiencies
- Reduce waste
- Improve flow and responsiveness
This transforms Data Analysis into a process optimization tool.
Using Dashboards to Expose Bottlenecks 🔍
Dashboards can visually highlight:
- Delays
- Cost drivers
- Quality issues
- Variability across processes
This makes value stream mapping dynamic, not a one-time workshop exercise.
📊 Applying Continuous Improvement Techniques 📊
Control Charts and Trend Monitoring 📉
Dashboards are ideal for control charts, enabling teams to:
- Monitor process stability
- Detect anomalies early
- Separate noise from real signals
This supports data-driven continuous improvement instead of gut-feeling decisions.
Pareto Analysis for Priority Setting 🧠
Using Pareto charts (80/20 rule) within dashboards helps teams:
- Focus on the most impactful issues
- Prioritize improvement initiatives
- Allocate resources effectively
This approach ensures improvements are strategic, not random.
🔄 Closing the Loop: Data → Insight → Action 🔄
Embedding Dashboards into Daily Operations ⚙️
Dashboards should not live only in management meetings. The most successful organizations:
- Embed dashboards into daily workflows
- Use them in stand-ups and reviews
- Link insights directly to actions and owners
This turns Data Analytics into an operational habit.
Measuring Improvement Over Time 📈
By tracking KPIs longitudinally, companies can:
- Validate improvement initiatives
- Compare before/after performance
- Sustain gains over time
Dashboards become the backbone of continuous improvement, not just visualization tools.
🔐 Security, Data Quality & Governance in Scraping Systems 🔐
As data scraping and dashboards become critical to decision-making, security and governance move from “IT concerns” to business-critical responsibilities. Poorly secured pipelines can expose companies to online attacks, data corruption, and strategic blind spots.
Why Scraping Systems Are High-Risk Assets 🎯
Scraping pipelines operate at the intersection of:
- External data sources
- Internal databases
- Analytical and reporting layers
This makes them attractive targets for:
- Injection attacks via malformed inputs
- Exploits using unsafe SQL command execution
- Traffic-based attacks triggering blocks or service disruption
A mature security solution treats scraping infrastructure as a core digital asset.
🛡️ Building a Secure Scraping Architecture 🛡️
Defense-in-Depth: More Than One Security Layer 🧱
A robust security service for data scraping should include:
- Input validation and sanitization
- Strict query parameterization (no raw SQL execution)
- Rate limiting and traffic control
- Separation of scraping, storage, and analytics environments
This layered approach reduces the blast radius of any single failure.
Protecting Infrastructure from Online Attacks 🚨
Scraping traffic can be misinterpreted as hostile by external platforms — or abused by attackers. To manage this, organizations often rely on:
- Web application firewalls
- Bot management solutions
- Traffic inspection tools that expose identifiers such as Cloudflare Ray ID for traceability
Clear ownership by the site owner ensures incidents are handled quickly and transparently.
🧼 Ensuring Data Quality and Trust 🧼
Detecting and Handling Malformed Data 🧩
Scraped data frequently arrives incomplete, inconsistent, or corrupted. High-quality Data Analysis requires:
- Schema validation
- Automated anomaly detection
- Rejection or quarantine of malformed data
- Clear data quality metrics displayed in dashboards
Without this, dashboards may look “correct” while being strategically misleading.
Preventing Silent Data Corruption 🔍
The most dangerous failures are silent ones. Implement:
- Row count checks
- Threshold alerts
- Change-detection rules
These controls ensure Data Analytics remains reliable over time.
🧭 Governance: Who Owns the Data and Decisions 🧭
Defining Roles and Responsibilities 🧑💼
Every scraping and analytics system needs clearly defined ownership:
- Site owner – accountable for external data sources
- Data owner – responsible for meaning and correctness
- Security owner – responsible for protection and incident response
Clear governance prevents confusion during failures or audits.
Compliance, Transparency, and Auditability 📋
Well-governed systems:
- Log all scraping activity
- Track data lineage from source to dashboard
- Document transformations and calculations
This is essential for compliance, internal trust, and scalable continuous improvement.
🔄 Security Without Slowing the Business 🔄
Automating Controls Instead of Adding Bureaucracy ⚙️
Modern security is embedded, not manual. Automated validation, monitoring, and alerting:
- Reduce human error
- Accelerate incident response
- Preserve agility
Security becomes an enabler of Data Analytics, not a blocker.
Aligning Security with Business Goals 🎯
The ultimate goal is balance:
- Strong protection against online attacks
- High data quality
- Fast access to insights
A well-designed security solution protects decision-making speed — not just infrastructure.
🚀 People, Skills & Operating Model for Long-Term Success 🚀
Technology alone does not create value. A data scraping and dashboard system delivers results only when supported by the right people, skills, and operating model. Organizations that succeed treat data as a capability, not a project.
Defining Key Roles in the Data Ecosystem 👥
A scalable setup clearly separates responsibilities:
- Business owner – defines questions, KPIs, and decisions
- Data Analytics team – transforms data into insights
- Data engineering / IT – maintains scraping pipelines and infrastructure
- Security owner – oversees the security service and risk controls
Clear ownership prevents bottlenecks and accelerates decision-making.
🧠 Building Data Literacy Across the Organization 🧠
From Dashboard Consumers to Data-Driven Teams 📊
Dashboards should empower teams, not intimidate them. This requires:
- Basic understanding of Data Analysis concepts
- Ability to interpret trends, anomalies, and signals
- Confidence to ask “why” instead of only “what”
Data-literate teams turn Data Analytics into everyday practice.
Avoiding the “Black Box” Effect ⚠️
When dashboards feel mysterious, trust erodes. Transparency matters:
- Clear metric definitions
- Visible data sources
- Documented logic and assumptions
Trust is a prerequisite for adoption and continuous improvement.
🔄 Embedding Continuous Improvement into Daily Work 🔄
Using Data as a Feedback Loop 🔁
High-performing organizations use dashboards to:
- Test hypotheses
- Validate changes
- Learn from outcomes
This creates a virtuous cycle: data → insight → action → measurement → improvement
Making Improvement Systematic, Not Occasional 📈
Instead of ad-hoc analysis, teams rely on:
- Regular KPI reviews
- Trend monitoring
- Root cause discussions
Dashboards become the backbone of continuous improvement, not just reporting tools.
🗺️ Implementation Roadmap: From Pilot to Scale 🗺️
Phase 1: Pilot and Validation 🧪
Start small:
- One business problem
- Limited data sources
- Simple dashboards
This phase validates assumptions and builds confidence.
Phase 2: Standardization and Security 🔐
Once value is proven:
- Standardize data pipelines
- Formalize governance
- Strengthen the security solution
Security and quality scale together with usage.
Phase 3: Expansion and Optimization ⚙️
Finally:
- Add new data sources
- Refine Data Analytics models
- Optimize dashboards for different roles
The system evolves with the business.
🧩 Aligning Technology, People, and Strategy 🧩
Why Most Data Initiatives Fail ❌
Common failure points include:
- No clear ownership
- Overly complex dashboards
- Ignoring data quality
- Treating security as an afterthought
Avoiding these pitfalls is as important as choosing the right tools.
What Success Looks Like ✅
A mature organization:
- Trusts its data
- Uses dashboards daily
- Protects systems with a robust security service
- Continuously improves based on evidence, not intuition
🌟 Conclusion: From Scraping to Strategic Advantage 🌟
Implementing a data scraping and dashboard system is not about scraping more data — it’s about making better decisions. When consultation, Data Analysis, security, dashboards, and people are aligned, data becomes a strategic asset.
Companies that embrace this approach move faster, learn faster, and improve continuously. In a world defined by volatility and information overload, that capability is a decisive competitive advantage.