
The retail market has become a constant battle for customer attention and every single percentage point of margin. Intense price competition, rapidly changing demand, and low margins mean that intuition-based decisions are no longer enough. In this case study, we show how combining data scraping with BI dashboards allowed a retail chain to regain control over pricing, react faster to market changes, and increase margin by 20%.
⚠️ The problem: Why margins erode in retail ⚠️
Price pressure and dynamic promotions 💸
Retail chains operate in an environment of continuous price comparison — both online and offline. Without up-to-date data:
- reactions to competitors’ moves are delayed,
- promotions become unprofitable,
- prices are often set “in the dark”.
Lack of market and customer transparency 👥
Market data, trends, and customer behavior are fragmented. Without connecting them:
- demand forecasting becomes unreliable,
- inventory planning suffers,
- decisions are reactive rather than strategic.
Manual work and data silos 🧱
In the analyzed retail chain:
- data was collected manually,
- reports were created with delays,
- each department worked with its own “version of the truth”.
Business impact: margin erosion 📉
Without access to:
- current competitor pricing,
- product availability insights,
- fast analysis of pricing impact on margin,
the organization could not effectively manage pricing at scale. A solution was needed that would combine market data, internal data, and automation into one coherent system.
Why the standard approach stopped working ⚠️
The retail chain operated in a highly competitive environment where small price differences directly impacted sales volume. The core issue was not the lack of data, but the lack of a consistent, up-to-date view of the market.
There was a clear gap between internal reports and real market conditions — and that gap was directly hurting margins.
Key organizational barriers 🧱
- Manual collection of competitor pricing and promotions
- Disconnected systems (sales, inventory, pricing)
- No single place to analyze prices and margins
- Decisions made reactively, after performance drops
As a result:
- prices were often set too low or too high,
- promotions were not always profitable,
- teams spent more time preparing data than analyzing it.
Business impact: growing margin pressure 📉
Without access to:
- real-time competitor prices,
- product availability signals,
- fast insights into how price changes affect margin,
the organization was unable to manage pricing effectively at scale. What was needed was a solution that could merge market data, internal performance data, and automation into one actionable view.
Solution architecture 🔧
The key objective was to build a single, consistent source of truth that connects market data with internal performance data. Instead of producing more Excel reports, we created an automated data pipeline running continuously in the background.
The solution was designed to:
- eliminate manual work,
- ensure data freshness,
- enable fast, confident business decisions.
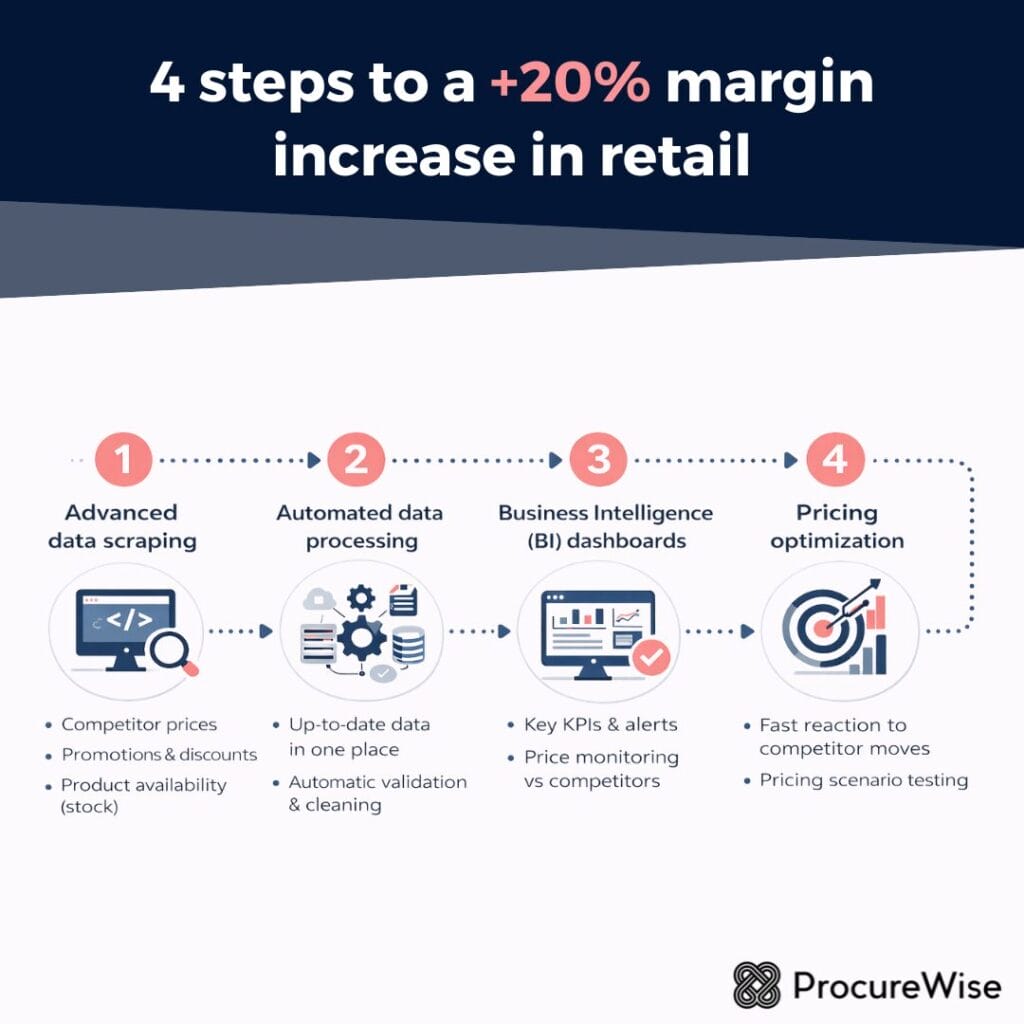
Market data scraping in practice 🌐
In the first phase, we implemented advanced retail data scraping, automatically collecting:
- competitor prices across thousands of SKUs,
- active promotions and discounts,
- product availability (in-stock / out-of-stock),
- assortment changes and new product launches.
The data was:
- collected multiple times per day,
- automatically validated and cleaned,
- standardized into a unified format.
This gave the pricing team a real-time view of the market, instead of delayed historical snapshots.
Integration with internal data 🔄
Scraped market data was combined with:
- sales data (POS / e-commerce),
- margin and cost structures,
- inventory levels,
- promotion calendars.
This made it possible to analyze not only what competitors were doing, but how each pricing decision impacted margin and volume.
BI dashboards as a decision-making tool 📊
We built clear, role-based BI dashboards tailored to specific business needs:
- Pricing & Category Managers – price vs. competitor monitoring and margin control
- Executives – fast KPI overviews and trend tracking
- Operations teams – alerts and price anomaly detection
Key capabilities included:
- 1:1 price comparisons with competitors,
- alerts for margin drops or aggressive competitor promotions,
- “what-if” analysis for price changes,
- near real-time data updates.
The key shift: from reactive to proactive ⚡
Instead of reacting after results dropped, the organization began to:
- anticipate competitor moves,
- test pricing scenarios in advance,
- optimize promotions before launch.
BI evolved from a reporting tool into a day-to-day operational system used across teams.
Measurable outcomes 📈
After the full rollout of data scraping and BI dashboards, the retail chain quickly achieved clear, measurable business results. Pricing decisions shifted from intuition-based to data-driven and market-aware.
Key results included:
- +20% margin increase in core product categories
- –15% reduction in unnecessary markdowns and promotion losses
- more stable pricing while remaining competitive
- decision-making cycles shortened from days to hours
Operational and organizational impact ⚙️
The transformation went beyond financial metrics and significantly changed how teams worked day to day:
- substantial reduction in manual analytical work,
- one shared dashboard instead of multiple disconnected reports,
- a common data language across pricing, buying, and leadership teams,
- faster responses to competitor actions.
BI became a daily operational tool, not a month-end reporting artifact.
What made the difference 🔑
- Automated market data collection (scraping instead of manual monitoring)
- Combining external market data with internal performance data
- Dashboards designed for decisions, not just visualization
- A strong focus on margin, not price alone
This combination ensured sustainable results rather than a one-off improvement.
Key lessons for other retail chains 🧠
If you operate in retail and:
- competitors frequently change prices,
- margins are under constant pressure,
- reports lag behind real market conditions,
then data scraping + BI is no longer a competitive advantage — it’s a necessity.
🔮 Final summary of the case study 🔮
Connecting real-time market intelligence with BI dashboards enables retailers to:
- shift from reactive to proactive pricing,
- protect and systematically grow margins,
- make faster, more confident decisions.
📌 This approach works — and it scales across categories, channels, and markets.