
In today’s competitive landscape, inventory management is no longer just an operational task — it is a strategic driver of profitability. One of the most underestimated threats to business performance is slow-moving inventory. These products quietly absorb working capital, occupy valuable warehouse space, and inflate carrying costs, while contributing little or nothing to sales volume.
Globally, inventory distortion — including excess stock, stockouts, and obsolete inventory — costs businesses over $1.6 trillion annually. For many companies, slow-moving products and non-moving inventory represent the largest hidden drain on cash flow and gross profit. This guide explains how to identify, analyze, and eliminate slow-moving inventory before it erodes your margins.
📦 What Are Slow-Moving Products? 📦
Slow-moving products (often called slow-moving inventory or SLOB) are items with low inventory turnover and weak sell-through rates over a defined period.
Key characteristics include:
- Low inventory turnover ratio
- High average days to sell inventory
- Minimal impact on sales data despite high stock levels
- Increasing holding costs and storage costs
In most industries, inventory that hasn’t sold within 90–180 days is considered slow-moving. Items unsold for 12 months or more often become obsolete inventory. For DTC and retail brands, slow movers can account for up to 30% of total inventory, far above healthy benchmarks.
💸Why Slow-Moving Inventory Hurts Business Performance 💸
Ignoring slow-moving products has a direct and measurable impact on working capital, profitability, and supply chains.
Financial Impact: Capital Locked in Stock 💰
Every unsold product ties up cash that could be invested in:
- High-demand SKUs
- Marketing strategies
- Demand forecasting tools
- New sales channels
Poor inventory turnover rates reduce liquidity and limit growth. Businesses with weak inventory control lose up to 11% of annual revenue due to overstocking and poor forecasting.
Operational Impact: Warehouse Space & Efficiency 🏭
Slow-moving inventory consumes:
- Valuable warehouse space
- Labor for handling and counting
- Time spent managing excess stock
Overcrowded warehouses reduce picking efficiency and increase operational errors, affecting overall inventory management performance.
Risk of Obsolescence and Write-Offs ⚠️
As products age, they face:
- Depreciation
- Changing customer preferences
- Market shifts and declining customer demand
In many companies, excess and obsolete inventory represents 20–30% of total inventory value, leading to costly write-offs and reduced gross profit.
📊 Step 1: Identifying Slow-Moving Inventory 📊
Accurate identification is the foundation of effective elimination.
Key Inventory Metrics to Track 📈
Monitor these KPIs regularly:
- Inventory turnover ratio
- Average days to sell
- Sell-through rate
- Sales volume vs. stock levels
Slow-moving inventory typically shows:
- Turnover below 4–6 times annually
- Average days to sell exceeding 60–90 days
Inventory Aging Reports 🗂️
An inventory aging report categorizes products by how long they’ve been in stock. This makes it easy to spot:
- Slow-moving products
- Non-moving inventory
- SKUs at risk of becoming obsolete
Segmenting reports by sales channels, product categories, or suppliers reveals deeper issues across your supply chain.
Jasne — jedziemy dalej 🔥 Poniżej część 2/4 (EN), zachowany styl, SEO, boldy, H2 z różnymi emoji po obu stronach, H3 z jednym emoji po prawej, treść bardziej skondensowana i jeszcze mocniej „pod tytuł”.
🧠 Step 2: Diagnose Why Products Stop Selling 🧠
Identifying slow-moving inventory is only half the battle. To eliminate it effectively — and prevent it from returning — you must understand why products stop moving. In most cases, sluggish sales are the result of a combination of market forces, forecasting errors, and internal execution gaps.
External Factors: Market & Customer Demand Shifts 🌍
Fluctuating customer demand is one of the most common causes of slow-moving products. Shifts in trends, seasonality, or economic conditions can quickly turn once-popular items into excess stock.
Key warning signs include:
- Declining sales volume
- Increasing average days to sell
- Lower engagement across sales channels
If customer preferences evolve and your inventory does not, products naturally slow down.
Competitive & Market Pressure: New competitors, substitute products, or aggressive pricing strategies can weaken demand. Without ongoing market analysis, inventory decisions are often based on outdated assumptions, leading to poor inventory turnover rates.
Internal Factors: Forecasting, Pricing & Visibility Gaps 🏢
Weak demand forecasting remains one of the biggest drivers of slow-moving inventory. Overestimating demand results in:
- Overstocking
- Rising holding costs
- Increased carrying cost per unit
Forecasting errors often stem from incomplete sales data, lack of historical analysis, or failure to adjust forecasts across different sales channels.
Pricing & Promotion Misalignment 💰
Products may stall simply because the price no longer matches perceived value. Common issues include:
- Prices higher than market alternatives
- Lack of flash sales or promotional triggers
- No incentives to improve sell-through rate
Without active pricing management, inventory stagnates.
Low Product Visibility 👀
Even strong products fail if customers don’t see them. Poor placement across sales channels, weak product descriptions, or limited marketing support can suppress sales — turning viable items into slow movers.
Product Lifecycle & Quality Risks 🔄
Every product has a lifecycle. Items nearing decline naturally experience lower demand, reduced inventory turnover, and higher risk of becoming obsolete inventory.
Failing to plan exit strategies early increases:
- Storage costs
- Risk of write-offs
- Margin erosion
Quality & Returns Issues ⚠️
Products with quality defects or high return rates generate negative feedback, suppressing demand and increasing non-moving inventory. These items often appear healthy in stock levels — but weak in real sales performance.
Why Diagnosis Matters Before Elimination 📌
Treating all slow-moving inventory the same leads to unnecessary losses. Accurate diagnosis allows you to:
- Decide between promotion, bundling, or liquidation
- Adjust inventory management policies
- Improve future forecasting accuracy
- Protect gross profit
Understanding why products slow down ensures that elimination strategies are targeted, profitable, and repeatable.
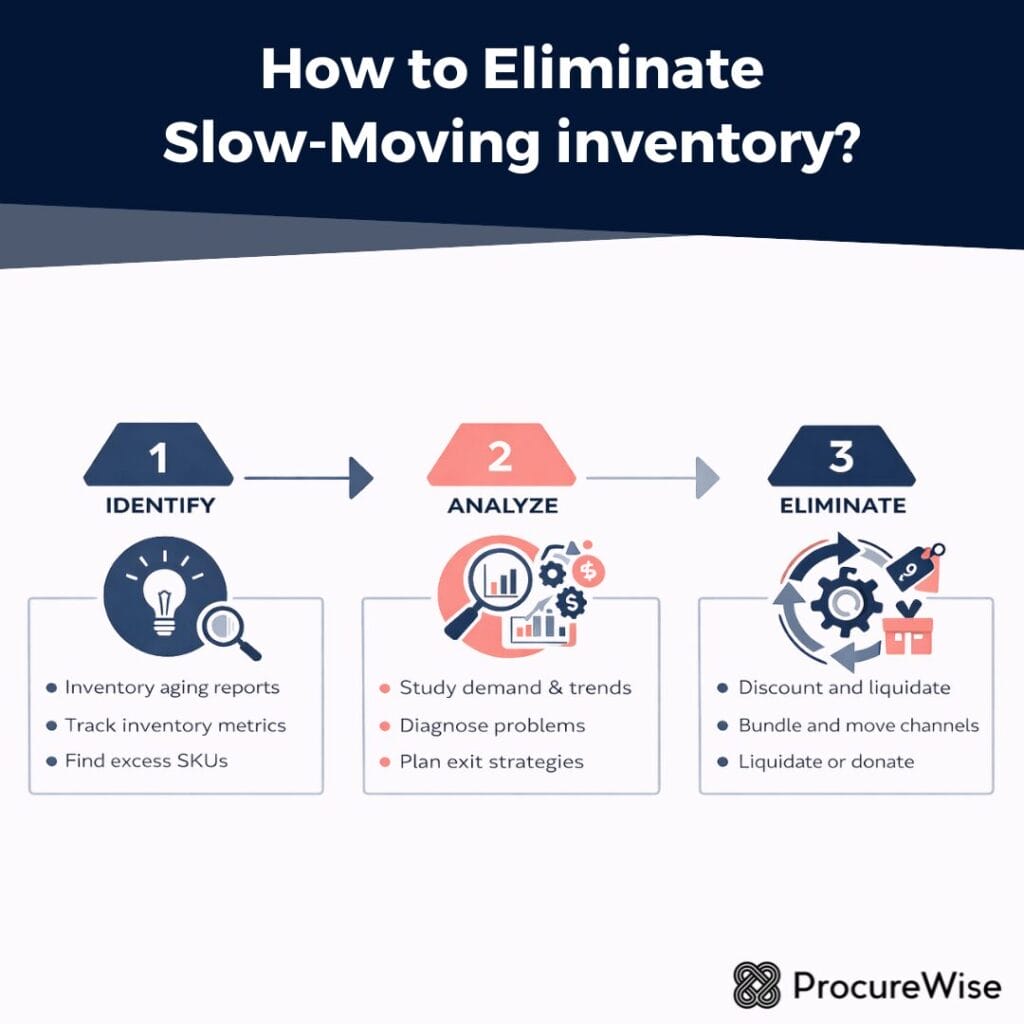
🛠️ Step 3: Eliminate Slow-Moving Inventory Strategically 🛠️
Once you understand why products stopped selling, the next step is action. The goal is not just to “get rid of stock,” but to recover cash, protect gross profit, and free up warehouse space without damaging brand perception.
A successful elimination strategy balances speed, margin, and operational efficiency.
Pricing & Promotions That Actually Move Stock 💸
Clearance & Flash Sales ⚡
Flash sales are one of the fastest ways to improve inventory turnover. Short, time-limited discounts create urgency and help convert slow-moving products into immediate cash.
Best practices:
- Limit duration to avoid brand erosion
- Focus on SKUs with high average days to sell
- Promote heavily across all sales channels
Clearance pricing works best when the carrying cost of holding inventory exceeds the margin loss from discounting.
Dynamic Discounting 📉
Instead of flat markdowns, apply tiered discounts based on:
- Inventory aging
- Sell-through rate
- Storage and holding costs
This protects margins while accelerating movement.
Bundling & Value-Based Offers 📦
Strategic Product Bundles 🎁
Bundling slow movers with high-demand items increases perceived value and improves sales volume without deep discounts.
Examples:
- Slow-moving accessory + best-selling core product
- End-of-line product bundled with seasonal items
Bundling improves inventory management efficiency and reduces excess stock discreetly.
Expand & Optimize Sales Channels 🌐
Alternative Sales Channels 🛒
If products stall in your primary channel, move them elsewhere:
- Marketplaces
- Outlet or discount stores
- Wholesale or bulk buyers
Different sales channels attract different price sensitivities and customer segments — critical for clearing excess stock.
Channel-Specific Pricing 🔁
Avoid price conflicts by adjusting offers per channel. This allows liquidation without harming your core pricing strategy.
Liquidation, Donations & Exit Decisions 🧯
Inventory Liquidation 🏷️
When products become non-moving inventory, liquidation may be the most rational choice. While margins are low, liquidation:
- Frees working capital
- Eliminates future storage costs
- Reduces write-off risk
♻Donations & Write-Off Optimization ♻️
For unsellable but usable stock, donation may be more cost-effective than continued storage. This reduces losses and improves operational focus.
Cost-to-Hold vs. Cost-to-Act Decision Framework ⚖️
Always compare:
- Cost to hold (storage, labor, capital, risk)
- Gain from action (cash recovery, space, focus)
When holding costs exceed potential profit, elimination is no longer optional — it’s strategic.
Perfekcyjnie — finał 🔥 Poniżej część 4/4 (EN): prewencja, systemowe podejście i mocne SEO-friendly zakończenie. Zachowane boldy, H2 z różnymi emoji po obu stronach, H3 z jednym emoji po prawej.
🧠 Step 4: Prevent Slow-Moving Inventory Before It Appears 🧠
The most profitable way to deal with slow-moving products is to stop them from accumulating in the first place. Prevention requires a shift from reactive clearance tactics to proactive inventory management, driven by data, discipline, and cross-team alignment.
Improve Demand Forecasting Accuracy 📈
Forecast with Real Sales Data 🔮
Accurate demand forecasting is the strongest defense against excess stock. High-performing businesses continuously refine forecasts using:
- Historical sales data
- Seasonality and promotions
- Channel-specific performance
- Changes in customer demand
Static forecasts quickly lead to overbuying and declining inventory turnover.
Cross-Functional Forecasting 🤝
Align sales, marketing, and supply chain teams. Shared assumptions reduce blind spots and improve forecast reliability across sales channels.
⚙️ Optimize Inventory Management Policies ⚙️
Smarter Reorder Points & Safety Stock 📏
Overstocking often results from overly cautious safety stock levels. Regularly adjust:
- Reorder points
- Minimum order quantities
- Target inventory turnover ratios
This reduces holding costs while protecting service levels.
Early Detection with Aging Reports 🔍
Frequent review of inventory aging reports allows teams to flag slow movers early — when pricing and promotion can still recover margin.
Strengthen Supply Chain Collaboration 🔗
Flexible Supply Chains 🚚
Closer collaboration with suppliers improves:
- Lead times
- Order flexibility
- Response to demand shifts
Agile supply chains reduce the risk of inventory piling up when forecasts change.
Feedback Loops with Suppliers 🔄
Sharing real-time sales and inventory insights prevents unnecessary replenishment and supports leaner inventory flows.
📊 Use Tools & Automation to Stay Ahead 📊
Inventory Management Software 🧩
Modern inventory management software automates:
- Inventory turnover tracking
- Aging analysis
- Alerts for non-moving inventory
- Forecast accuracy monitoring
Automation ensures issues are detected before storage costs and capital exposure escalate.
🏁 Conclusion: Turn Inventory into a Growth Engine 🏁
Slow-moving inventory is not just an operational nuisance — it’s a strategic signal. Businesses that actively monitor inventory turnover, act decisively on slow-moving products, and invest in smarter forecasting tools unlock faster cash cycles and stronger gross profit.
By combining:
- Data-driven identification
- Targeted elimination strategies
- Proactive prevention systems
you transform inventory from a silent drain into a competitive advantage. The result? More working capital, better warehouse space utilization, and an inventory that truly supports growth — not slows it down.